
A new MRI-based predictive model called SCAN-MRI can better identify cardiovascular risk in patients with type 2 diabetes compared to current established risk scores. The model combines cardiac MRI imaging with clinical factors to achieve superior accuracy in predicting heart disease and heart failure outcomes.
- SCAN-MRI outperformed established risk models with an AUC of 0.76 compared to WATCH-DM (0.66) and other standard models (0.65)
- The model was tested on 1,388 diabetes patients using 3-T or 1.5-T MRI scans with 37.6 months median follow-up
- Adding cardiac MRI markers to existing risk models significantly improved their performance (AUCs increased to 0.73-0.74)
- Researchers recommend integrating cardiac MRI into clinical practice for better risk stratification and personalized treatment in diabetic patients
An MRI-based predictive model could help predict adverse cardiovascular outcomes in patients with diabetes, according to findings published July 28 in Radiology.
The model showed good discrimination and better performance than current established risk models, wrote a team led by Wenjing Yang, PhD, from the Chinese Academy of Medical Sciences and Peking Union Medical College in Beijing and colleagues.
“Additionally, MRI-derived predictors demonstrated added value in enhancing the predictive performance of existing risk models for participants with diabetes mellitus,” Yang and co-authors wrote.
Patients with diabetes mellitus have a higher risk of future adverse cardiovascular outcomes. Current risk scores for these patients rely on clinical risk factors. The researchers pointed out that this approach ignores parameters such as imaging biomarkers that directly reflect cardiac structure and function.
The Yang team developed its cardiac MRI-based predictive model for cardiovascular outcomes among participants with type 2 diabetes. It evaluated the model’s performance in comparison with established clinical risk models.
The study included 1,388 participants with diabetes, all of whom underwent either 3-T or 1.5-T MRI. For the model’s development, the researchers placed 810 participants into the training set and 578 into the test set. In the test set, 145 participants either experienced heart failure hospitalization or died of cardiovascular disease during a median follow-up of 37.6 months.
The model achieved a C index of 0.73, showing good discrimination “and acceptable calibration.”
The team created an integer-based risk score from the model, using clinical- and imaging-based risk predictors, to predict three-year outcome incidence. These risk predictors included: sex, coronary artery disease, age, atrial fibrillation, N-terminal pro-B-type natriuretic peptide, and MRI variables. The team named the risk score SCAN-MRI.
 Representative cardiac MRI strain images and analysis. Images in the two-, four-, and three-chamber views for strain analysis (left) and left ventricular global longitudinal strain (GLS) and global early diastolic longitudinal strain rate (eGLSR) curves (right) are shown. (A) Example images and GLS and eGLSR curves in a 37-year-old male participant with diabetes mellitus (DM) without events during follow-up after cardiac MRI. (B) Example images and GLS and eGLSR curves in a 45-year-old male participant with DM who had heart failure hospitalization during follow-up after cardiac MRI. In the left images, blue represents higher myocardial strain (higher absolute values of negative strain), whereas red represents reduced strain. In the curves, blue represents GLS, whereas orange represents eGLSR. The left y-axis denotes GLS (%), the right y-axis represents eGLSR (per second), and the x-axis denotes time (milliseconds). For these strain parameters, a lower absolute value indicates more severe myocardial functional impairment; accordingly, GLS and eGLSR were more impaired in participants with events compared with those without events.RSNA
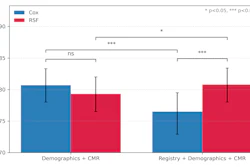
SCAN-MRI achieved a higher area under the under the receiver operating characteristic curve (AUC, 0.76) compared to the established WATCH-DM (AUC, 0.66) and Thrombolysis in Myocardial Infarction Risk Score for Heart Failure in Diabetes risk models (AUC, 0.65). SCAN-MRI’s performance achieved statistical significance compared to these models (both p < 0.001).
The researchers noted improvement to the established risk models when cardiac MRI markers were added. This included AUCs of 0.74 for WATCH-DM and 0.73 for Thrombolysis in Myocardial Infarction Risk Score for Heart Failure in Diabetes (p < 0.001 for both increases).
Finally, SCAN-MRI showed good performance in the external test set for predicting adverse outcomes (C index, 0.71).
“Our findings highlighted the importance of integrating cardiac MRI into clinical practice to refine risk prediction in participants…, potentially improving clinical outcomes,” the study authors wrote.
The authors called for future studies to find out whether MRI-guided risk stratification can improve clinical decision-making and guide personalized therapies in patients with diabetes.
SCAN-MRI is an example of how integrating imaging biomarkers with clinical factors can aid with risk assessment for these patients, according to an accompanying editorial written by Akos Varga-Szemes, MD, PhD, and Tilman Emrich, MD, from the Medical University of South Carolina in Charleston.
The two called for multicenter prospective validation when exploring the effectiveness of these models.
“Calcium scoring became a guideline-endorsed test only after prospective multicenter validation, standardized and largely automated quantification, and evidence that it changed management,” they wrote. “Myocardial phenotyping in diabetes will likely need the same: validation in diverse and unselected populations with transparent recalibration of thresholds, reproducible automated strain measurement across vendors, and prospective data showing that imaging-guided stratification improves decisions or outcomes.”
Read the full study here.

.fFmgij6Hin.png?auto=compress%2Cformat&fit=crop&h=100&q=70&w=100)



.fFmgij6Hin.png?auto=compress%2Cformat&fit=crop&h=167&q=70&w=250)


