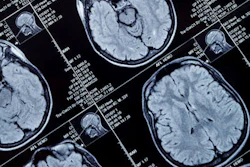
MRI indicates that people in early middle age with poor sleep quality show signs of poor brain health in the form of older brain age later in life, according to research published October 23 in Neurology.
Although the study doesn't prove that poor sleep accelerates brain aging, it suggests an association between poor sleep quality and signs of brain aging, noted lead author Clémence Cavaillès, PhD, of the University of California, San Francisco in a statement released by the American Academy of Neurology.
"Sleep problems have been linked in previous research to poor thinking and memory skills later in life, putting people at higher risk for dementia," Cavaillès said. "Our study -- which used brain scans to determine participants' brain age -- suggests that poor sleep is linked to nearly three years of additional brain aging as early as middle age."
Sleep disturbances have been associated with poor cognitive outcomes and a higher risk of developing Alzheimer's disease and Alzheimer's disease-related dementias, the investigators noted. But research to this effect has focused on older adults rather than younger ones, "despite the fact that [Alzheimer's disease] pathology begins in the brain several decades beyond the onset of clinical symptoms," they wrote.
To address this knowledge gap, Cavaillès' group conducted a study that included 589 people with an average age of 40. Research participants completed sleep questionnaires at the start of the study and again five years later; they underwent brain MRI exams 15 years after the work began.
The investigators tracked six poor sleep characteristics, including the following:
- Short sleep duration
- Bad sleep quality
- Difficulty falling asleep
- Difficulty staying asleep
- Early morning awakening
- Daytime sleepiness
Study participants were slotted into three groups: A "low" group with no more than one poor sleep characteristic; a middle group with two or three; and a high group with more than three. At the start of the work, 70% of participants were in the low group, 22% in the middle group, and 8% in the high group. Cavaillès and colleagues assessed participants' brain scans, reviewing the level of brain shrinkage corresponding to age, and used machine learning to determine brain age for each person.
The investigators found that, after adjusting for age, sex, high blood pressure, and diabetes, people in the middle group had an average brain age that was 1.6 years older than those in the low group, and those in the high group had an average brain age that was 2.6 years older. Bad sleep quality, difficulty falling asleep, difficulty staying asleep and early morning awakening were associated with greater brain age, especially when these poor sleep characteristics manifested over a five-year period.
Helping individuals maintain healthy sleep could be a key factor in preventing potential neurocognitive adverse outcomes, according to the researchers.
"Our findings highlight the importance of addressing sleep problems earlier in life to preserve brain health, including maintaining a consistent sleep schedule, exercising, avoiding caffeine and alcohol before going to bed, and using relaxation techniques," study co-author Kristine Yaffe, MD, said in the statement. "Future research should focus on finding new ways to improve sleep quality and investigating the long-term impact of sleep on brain health in younger people."
The complete study can be found here.