
Machine-learning algorithms can diagnose obstructive sleep apnea on brain MRI exams much faster than methods currently used to identify the sleep disorder, according to research published on October 12 in the Journal of Sleep Research.
A team of researchers from the University of California, Los Angeles (UCLA) led by Bo Pang and Suraj Doshi trained machine-learning algorithms to identify sleep apnea on diffusion tensor imaging (DTI)-MRI. In testing, the models performed comparably, yielding areas under the curve of 0.84 and 0.85 for diagnosing sleep apnea.
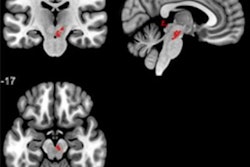
Obstructive sleep apnea is currently diagnosed in a number of ways, including overnight polysomnography at a sleep laboratory. However, this method is costly and requires evaluating many hours' worth of data. In an effort to develop a faster technique, an interdisciplinary UCLA group performed DTI-MRI on 59 people with obstructive sleep apnea and 96 healthy controls.
They then trained and tested two types of machine-learning models -- a support vector machine and a random forest -- to assess mean diffusivity maps from the brain MRI exams for obstructive sleep apnea. Both algorithms showed promising results.
| Performance of machine-learning algorithms for obstructive sleep apnea | ||
| Accuracy | Area under the curve | |
| Support vector machine algorithm | 77% | 0.85 |
| Random forest model | 73% | 0.84 |
"The findings have important implications for developing a new, fast, less complicated, and widely available [obstructive sleep apnea] screening tool, which can help with early identification, and thus, early intervention for breathing conditions," the authors wrote. "Earlier diagnosis would in turn be of great benefit in restoring brain tissue changes and functions, which could improve the morbidity, mortality, and quality of life in [obstructive sleep apnea] patients."


![Overview of the study design. (A) The fully automated deep learning framework was developed to estimate body composition (BC) (defined as subcutaneous adipose tissue [SAT] in liters; visceral adipose tissue [VAT] in liters; skeletal muscle [SM] in liters; SM fat fraction [SMFF] as a percentage; and intramuscular adipose tissue [IMAT] in deciliters) from MRI. The fully automated framework comprised one model (model 1) to quantify different BC measures (SAT, VAT, SM, SMFF, and IMAT) as three-dimensional (3D) measures from whole-body MRI scans. The second model (model 2) was trained to identify standardized anatomic landmarks along the craniocaudal body axis (z coordinate field), which allowed for subdividing the whole-body measures into different subregions typically examined on clinical routine MRI scans (chest, abdomen, and pelvis). (B) BC was quantified from whole-body MRI in over 66,000 individuals from two large population-based cohort studies, the UK Biobank (UKB) (36,317 individuals) and the German National Cohort (NAKO) (30,291 individuals). Bar graphs show age distribution by sex and cohort. BMI = body mass index. (C) After the performance assessment of the fully automated framework, the change in BC measures, distributions, and profiles across age decades were investigated. Age-, sex-, and height-adjusted body composition reference curves were calculated and made publicly available in a web-based z-score calculator (https://circ-ml.github.io).](https://img.auntminnie.com/mindful/smg/workspaces/default/uploads/2026/05/body-comp.XgAjTfPj1W.jpg?auto=format%2Ccompress&fit=crop&h=100&q=70&w=100)


![Overview of the study design. (A) The fully automated deep learning framework was developed to estimate body composition (BC) (defined as subcutaneous adipose tissue [SAT] in liters; visceral adipose tissue [VAT] in liters; skeletal muscle [SM] in liters; SM fat fraction [SMFF] as a percentage; and intramuscular adipose tissue [IMAT] in deciliters) from MRI. The fully automated framework comprised one model (model 1) to quantify different BC measures (SAT, VAT, SM, SMFF, and IMAT) as three-dimensional (3D) measures from whole-body MRI scans. The second model (model 2) was trained to identify standardized anatomic landmarks along the craniocaudal body axis (z coordinate field), which allowed for subdividing the whole-body measures into different subregions typically examined on clinical routine MRI scans (chest, abdomen, and pelvis). (B) BC was quantified from whole-body MRI in over 66,000 individuals from two large population-based cohort studies, the UK Biobank (UKB) (36,317 individuals) and the German National Cohort (NAKO) (30,291 individuals). Bar graphs show age distribution by sex and cohort. BMI = body mass index. (C) After the performance assessment of the fully automated framework, the change in BC measures, distributions, and profiles across age decades were investigated. Age-, sex-, and height-adjusted body composition reference curves were calculated and made publicly available in a web-based z-score calculator (https://circ-ml.github.io).](https://img.auntminnie.com/mindful/smg/workspaces/default/uploads/2026/05/body-comp.XgAjTfPj1W.jpg?auto=format%2Ccompress&fit=crop&h=112&q=70&w=112)


