Integrating radiology report features into a deep-learning (DL) algorithm improves the model's ability to identify brain lesions on MRI exams, researchers have reported.
The results could translate into improvements in diagnosis, wrote a team led by Lisong Dai, PhD, of Shanghai Jiao Tong University School of Medicine in China. Dai's and colleagues' findings were published October 9 in Radiology: Artificial Intelligence.
"This collaborative multimodal approach not only boosts diagnostic performance but also offers interpretable insights to radiologists, paving the way for advanced, efficient disease diagnosis and improved clinical decision-making," the authors noted.
MRI is an essential tool for diagnosing disease in the brain, but because brain lesions tend to be quite varied in their presentation, MR imaging to diagnose them can be prone to error, the group explained. Deep-learning models have been developed to address this problem, but more work remains to make them as effective as needed.
Dai's team explored whether adding radiology report data to a deep-learning model would improve the algorithm's ability to identify lesions on MRI exams via a study that included 35,282 brain MRI scans taken between January 2018 and June 2023 as well as corresponding radiology reports; these exams were used to train, validate, and internally test two deep-learning algorithms. In addition, 2,655 brain MRI scans taken between January and December 2022 were used for external testing. (The exams came from five different hospitals, with the 35,282 coming from center 1 and the 2,655 from centers 2, 3, 4, and 5.)
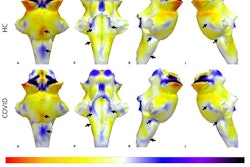
The researchers extracted textual features (i.e., lesion characteristics) from 500 radiology reports to guide the DL model (ReportGuidedNet); they also used another model (PlainNet) that did not have these textual features for comparison. Both were tasked with diagnosing 15 conditions, which included 14 diseases and normal brains. The authors assessed the performance of each model by calculating macro- and micro-averaged area under the receiver operating characteristic curves (ma-AUC, mi-AUC) and assessed attention maps with a 5-point Likert scale. (Attention maps reveal how much attention each pixel in the imaging input receives when the model focuses on it.)
ReportGuidedNet outperformed PlainNet for all diagnoses on both internal and external testing sets, the group reported.
| Comparison of 2 deep-learning algorithms for improving MRI's ability to identify brain lesions | ||
|---|---|---|
| Measure | PlainNet | ReportGuidedNet |
| Internal testing set | ||
| Macroaveraged AUC | 0.85 | 0.93 |
| Microaveraged AUC | 0.89 | 0.93 |
| External testing set | ||
| Macroaveraged AUC | 0.75 | 0.91 |
| Microaveraged AUC | 0.76 | 0.9 |
The group also found that ReportGuidedNet's Likert scale score was higher than that of PlainNet, at 2.5 compared to 1.32.
Incorporating radiology report textual features improved the DL algorithm's ability to identify brain lesions and improved exam interpretability, the authors concluded.
"The model, which represents a cost-effective strategy that harnesses expert knowledge, showed enhanced diagnostic performance and accuracy across brain diseases compared with a model that did not use radiology report-derived textual features," they wrote.
The complete study can be found here.