Deep-learning (DL) radiopathomics models can help predict the presence of vessels encapsulating tumor clusters (VETC) in hepatocellular carcinoma (HCC) -- a tumor form linked to poor patient outcomes, according to a study published March 14 in Radiology: Imaging Cancer.
The models can also assess the risk for early recurrence and progression-free survival, noted a team led by Yixing Yu, MD, of the First Affiliated Hospital of Soochow University in Suzhou, China.
"VETC is a novel vascular pattern of HCC associated with poor prognosis and benefit of sorafenib treatment," the group wrote. "In this study, we developed and validated DL radiomics and pathomics models for predicting [it]."
HCC is the third leading cause of cancer death around the world, the investigators wrote, and despite advances in diagnosis and treatment, the prognosis for advanced disease remains poor, in part because it can be tricky to characterize HCC tumors.
That's why deep learning shows promise for predicting the biologic features of tumors, according to the authors. Combining deep-learning radiomics with pathomics (that is, data from digital pathologic images that have been converted into quantitative features to characterize tissue samples) could further improve HCC assessment, especially when VETC are involved. (VETCs are a particular vascular pattern in hepatocellular carcinoma in which tumor clusters are surrounded by sine-wave-like vessels that form cobweb-like networks; previous research has associated them with a novel metastasis mechanism and poorer prognosis.)
Yu and colleagues investigated whether deep-learning radiopathomics models based on gadoxetic acid-enhanced MRI and pathologic images could help predict VETC and survival in HCC. They developed the models (DL radiomics, DL pathomics, and a radiopathomics nomogram) then conducted a study that included 578 patients with HCC who were divided into training (n = 317), internal (n = 137), and external (n = 124) test sets, then compared model scores between patients with a VETC pattern in HCC and those without.
The team found the following:
- In the external test set, both the deep-learning radiomics and deep-learning pathomics models showed good performance for predicting VETC (DL radiomics area under the ROC curve [AUC], 0.77, and DL pathomics AUC, 0.79).
- Patients with VETC pattern in HCC had significantly higher DL radiomics and DL pathomics scores compared with patients without the pattern in all datasets (p < 0.001).
- The radiopathomics nomogram model showed a statistically significant difference between high- and low-risk patients for predicting early recurrence and progression-free survival rates (p < 0.05).
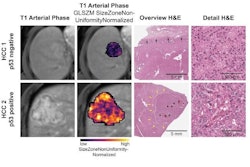
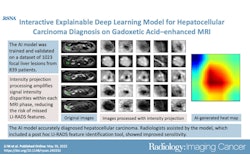
 Deep-learning radiopathomics models visualization. (A-D) Gradient-weighted class activation mapping (Grad-CAM) heatmaps of ResNet50, DenseNet121, Vision Transformer, and Swin Transformer models are shown based on the axial arterial-phase images, portal venous phase images, hepatobiliary phase images, and hematoxylin eosin-stained images (original magnification, ×100) in a 71-year-old female patient with hepatocellular carcinoma. Red designates the activation region associated with vessels completely encapsulating tumor clusters. Images and caption courtesy of the RSNA.
The study findings are promising, but more research is needed, according to the authors.
"In the future, prospective clinical trials are needed to validate the utility of the radiopathomics nomogram models in diverse patient populations," they concluded.
The complete study can be found here.