When radiologists’ interpretations are indeterminate, a commercially available deep learning algorithm could find clinically significant prostate cancer with improved specificity while maintaining sensitivity, suggested research published March 11 in Radiology.
A team led by radiologist Young Joon Lee, MD, PhD, and urologist Hyong Woo Moon, MD, PhD, both from The Catholic University of Korea in the Republic of Korea, compared the diagnostic performance of the prostate cancer AI and radiologists’ clinical reports for cancer detection. The findings could help clinicians tailor biopsy recommendations for men with low- to intermediate risk of the disease, according to the authors.
"Standard clinical practice has shifted from conducting systematic prostate biopsies without MRI guidance to using MRI-guided biopsies," the team wrote. "Although controversial, there is a growing trend toward avoiding systematic biopsy in patients with negative MRI results and a low to intermediate risk of prostate cancer (PCa) and instead performing targeted biopsy alone."
The study addresses variability in prostate MRI interpretation that can lead to inconsistent results, wrote Lee, Moon, and colleagues, who explored the clinical impact of the deep learning algorithm targeting prostate cancer.
To assess the algorithm’s potential impact, the team prospectively enrolled 205 men at an average age of 68, from December 2022 to July 2023 at two Seoul hospitals. Study participants were scheduled for targeted prostate biopsy for lesions with Prostate Imaging Reporting and Data System (PI-RADS) scores of 3 or higher, based on clinical information including prostate MRI.
A majority (179) of participants underwent multiparametric MRI, the authors noted. MRI images were acquired in accordance with PI-RADS recommendations, and histopathologic findings from biopsy specimens served as the reference standard. No specific MRI image quality assessment was performed, but participants were excluded if they had incomplete or poor-quality MRI scans, the authors said.
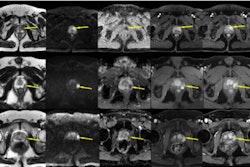
 MRI scans show two areas of clinically significant prostate cancer in a 65-year-old man with a prostate-specific antigen level of 8.23 ng/mL. Images are (A, E) axial T2-weighted images, (B, F) axial diffusion-weighted images obtained with a b value of 1500 sec/mm2, (C, G) axial apparent diffusion coefficient images, and (D, H) lesion masks generated by the deep learning algorithm (DLA) on T2-weighted images. The DLA detected a lesion in the right posteromedial peripheral zone of the apex (D), which was assigned as Prostate Imaging Reporting and Data System (PI-RADS) 4. A radiologist also detected the lesion and assigned it PI-RADS 4 (arrow in A-C). A lesion in the right anterior transition zone (H) was detected by the DLA, which was assigned PI-RADS 4. The radiologist did not detect the lesion (arrow in E-G). Both lesions were confirmed as prostate cancer with Gleason grade group 2. Caption and image courtesy of RSNA.
The algorithm outputs segmentations of the prostate gland and transition zone, as well as a segmentation, volume, and proposed PI-RADS classification of detected lesions.
Of the 259 lesions that the deep learning algorithm evaluated, 117 were clinically significant prostate cancers (csPCa), defined as Gleason grade group ≥ 2. Per lesion, the algorithm demonstrated 80.3% sensitivity, compared with 93.2% sensitivity of experienced radiologists (i.e., 7 to 20 years of experience). Lee, Moon, and colleagues reported a positive predictive value (PPV) of 57.7% compared with the radiologists' 48%.
Per participant, however, the algorithm demonstrated a significant increase in specificity, 64.8% compared with radiologists’ 21.3% for 108 participants with csPCa, according to the report.
| Per-participant analysis clinically significant prostate cancer (csPCa) | ||
|---|---|---|
| Performance metric | Radiologist | Algorithm |
| Sensitivity | 99% | 87.6% |
| Specificity | 21.3% | 64.8% |
| Positive predictive value (PPV) | 53% | 69.1% |
| Negative predictive value (NPV) | 95.8% | 85.4% |
| Area under the receiver operating characteristic curve (AUC) | 0.77 | 0.79 |
| AUC (lesions with a volume of less than 0.5 cm) | 0.69 | 0.53 |
This study had several limitations, the team explained. It included participants scheduled for prostate biopsy based on clinical MRI reports, potentially introducing a bias toward MRI-detected lesions. Also, the algorithm's performance metrics were relative to those of radiologists, not absolute measures for the general population undergoing prostate MRI.
Lee, Moon, and colleagues concluded that the specificity significantly increased in the scenario in which the radiologist PI-RADS 3 score was modulated by the DLA-based PI-RADS score.
“Using the DLA results when radiologists’ interpretations are indeterminate could improve specificity while maintaining sensitivity,” they said.
Read the full study here.