Breast MRI offers clinicians a way to objectively measure background parenchymal enhancement, or BPE -- which has been linked to increased breast cancer risk, researchers have found.
"[We found that] quantitative background parenchymal enhancement (BPE) measured using a fully automated method at MRI is associated with increased breast cancer odds for pre- and postmenopausal women after accounting for fibroglandular tissue, fat volume, reproductive factors, and breast cancer risk factors," wrote a team led by Gordon Watt, PhD, of Memorial Sloan Kettering Cancer Center in New York City.
High levels of BPE as identified on breast MRI has been linked with increased odds of breast cancer for both premenopausal and postmenopausal women. But how best to assess BPE -- which tends to be a subjective task -- has made using it as a risk indicator to remain unclear.
To address the knowledge gap, Watt's group sought to explore any associations between objective measures of BPE on MR imaging and odds of breast cancer. The team conducted a study that included 1,476 women who underwent a bilateral breast MRI exam between November 2010 and July 2017 (of these, 536 had breast cancer and 940 did not). The researchers quantified breast and fibroglandular tissue volume and BPE, defining BPE extent as the proportion of fibroglandular voxels with enhancement on MRI of 20% or more; they defined fat volume as breast volume minus fibroglandular tissue volume. Finally, they estimated any correlations between quantitative extent of BPE and Breast Imaging Reporting and Data System (BI-RADS) BPE categories.
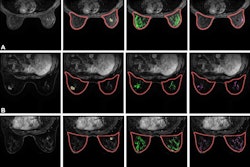
 Examples of automatic fibroglandular tissue (FGT) segmentations on the precontrast (T1) non-fat saturated series and background parenchymal enhancement
(BPE) extent on the postcontrast (T2) series for four control participants. For each participant, the left image shows the automated whole-breast segmentation (green line) and FGT segmentation (purple shading). The right image shows the areas of enhancement (red shading) within the FGT, defined as all voxels with 20% or more enhancement from the precontrast to postcontrast series. For each series, the middle section is presented. Example images were selected randomly within four categories defined by quantitative FGT volume (Vol) and BPE extent, where “low” refers to participants with measures in the bottom tertile and “high” refers to participants with measures in the top tertile. (A) Low FGT volume and low BPE extent in a 50-year-old premenopausal control participant. (B) Low FGT volume and high BPE extent in a 50-year-old control participant with a history of bilateral oophorectomy. (C) High FGT volume and low BPE extent in a 39-year-old premenopausal control participant. (D) High FGT volume and high BPE extent in a 44-year-old premenopausal control participant. Images and caption courtesy of the RSNA.
The group found that the extent of BPE associated positively to BI-RADS BPE categories, and that women with higher BPE (range, 50.7% to 97.3%), had increased odds of breast cancer compared to those with lower BPE (range, 2.9% to 34.2%) in a model that took fibroglandular tissue and fat volume into account. It also found the following:
- Compared with low BPE extent, high BPE extent was associated with increased odds of breast cancer, with an odds ratio of 1.74 (with 1 as reference).
- This association of high BPE with increased odd of breast cancer appeared in both premenopausal and postmenopausal women (odds ratios, 1.75 and 1.83 respectively, with P=0.73).
Watt and colleagues hope the study findings will prompt further research.
"Future longitudinal studies are needed to assess the added value of objective measurement of BPE for prospective breast cancer risk prediction beyond risk prediction models," they wrote. "In the long term, BPE could be used with breast density and other breast cancer risk factors to improve assessment of breast cancer risk and personalize breast cancer screening plans."
The complete study can be found here.