Gadopiclenol shows comparable performance at a lower contrast dose for visualizing central nervous system lesions on MRI compared to other gadolinium-based contrast agents (GBCAs), according to research presented November 30 at the RSNA annual meeting.
Presenter Dr. Leo Wolansky of UConn Health in Farmington, CT, and colleagues found that using gadopiclenol at 0.05 mmol/kg with central nervous system MRI was just as effective as using gadobutrol at 0.1 mmol/kg. The findings were part of the PICTURE trial, which compared the two agents.
There has been longstanding concern as to whether GBCAs may cause harm to patients due to gadolinium deposition disease (retention of the agent in the body long after a person undergoes an MRI exam) and nephrogenic systemic fibrosis (a disease that can affect individuals with compromised kidney function). Using GBCAs at lower doses could help mitigate risk of these conditions, and one of the reasons gadopiclenol appears to be a promising alternative to GBCAs that require higher doses to be effective is because it has a relaxivity of more than twice that of, for example, gadobutrol, at 11.6 mM-1*sec-1 compared to 5 mM-1*sec-1 (higher relaxivity values indicate contrast effectiveness at a lower dose).
But does gadopiclenol produce clinically useful results? Wolansky and colleagues sought to explore this question, comparing gadopiclenol to gadobutrol via a study that included 250 patients with central nervous system lesions that had been identified on previous imaging within 12 months. The most common form of disease was meningioma (29.7%).
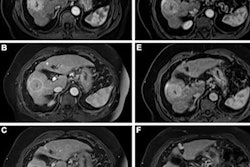
Patients were randomized to undergo two MRIs with gadopiclenol and then gadobutrol (or vice versa) over a 14-day interval. Three readers assessed the clarity of lesion visualization by such measures as the delineation of the lesion border, its internal morphology, and contrast enhancement, ranking these measures on a four-point scale (with 1 equal to poor and four equal to excellent). Wolansky and colleagues tracked the percentage of enhancement, lesion-to-background ratio, and contrast-to-noise ratio, and any adverse events that occurred within a day after the second MRI exam.
The study showed that gadopiclenol performed on par with gadobutrol in all of the visualization criteria (p < 0.0001). But it actually outperformed gadobutrol when it came to the two measures of the percentage of enhancement and lesion-to-background ratio (p < 0.0001).
What's more, readers preferred gadopiclenol MRI images in 44.8% to 57.3% of the exams. As for adverse events, their incidence was similar between the two agents, with a rate of 14.6% for gadopiclenol and 17.6% for gadobutrol; these events were mainly injection site reactions and weren't serious, Wolansky noted.
The findings are in line with guidance from professional and regulatory organizations that seek to ensure patient safety when it comes to contrast-enhanced MRI, according to Wolansky, who cited the European Medicines Agency's recommendation.
"The European Medicines Agency (EMA) has stated that 'macrocyclic agents should be used in the lowest doses that enhance images sufficiently,'" he told session attendees. "The noninferiority of gadopiclenol at one-half dose of other agents seems a good way to do this."