Wednesday, December 2 | 10:20 a.m.-10:30 a.m. | VN41-08 | Room N228
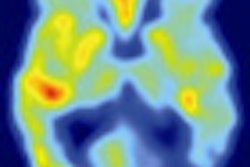
Ever wonder how caffeine kick-starts the brain after that morning coffee? Japanese researchers may have an answer, as they used 3-tesla arterial spin-labeled MRI (ASL-MRI) to show how caffeine intake induces global and regional perfusion changes in the brain.Caffeine is known to produce an increase in neurotransmitters, such as glutamate and dopamine, to wake cerebral vessels. However, caffeine's effect on global and regional cerebral blood flow is not fully understood.
"We carried out arterial spin labeling with the advantage of long T1-weighted relaxation times and high signal-to-noise ratio due to 3T. As arterial spin-labeling perfusion does not involve ionizing radiation or exogenous contrast media injection, it is suitable for performing volunteer studies," said co-author Dr. Toshinori Hirai in the department of diagnostic radiology at Kumamoto University.
The study took nine healthy volunteers ranging from 23 to 38 years of age and performed volumetric T1-weighted and arterial spin labeling 30 minutes after the delivery of 200 mg of caffeine. The subjects were prohibited from ingesting caffeine during the seven hours preceding the experiment.
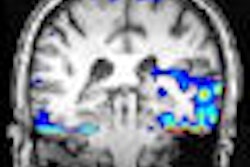
After caffeine intake, the mean standard deviation in the global cerebral blood flow for gray matter and white matter was 15.8 ± 12.9% and 16.6 ± 16.1%, respectively. The regions of the brain exhibited a significant global cerebral blood flow reduction (p < 0.05) and significant regional cerebral blood flow hypoperfusion in the bilateral medial occipital lobes (p < 0.005).
As for potential future research, Hirai suggested that the response and change of brain perfusion with antipsychotic drugs could be evaluated by using arterial spin labeling.