PET Oncologic Imaging:
[18]F-fluorodeoxyglucose (FDG) Imaging:
Basic principles:
The transport of glucose into a cell is mediated by a family of structurally related glucose transporter proteins [23]. One of the biochemical characteristics of malignant cells in an enhanced rate of glucose metabolism due to increased number of these cell surface glucose transporter proteins (such as Glut-1 and Glut-3) and increased intracellular enzyme levels of hexokinase and phosphofructokinase which promote glycolysis [4,16,20]. This enhanced glycolytic rate of malignant cells facilitates their detection utilizing PET FDG imaging.
Several processes determine FDG uptake in tumor cells [28].
Of major importance is the integrity of the vascular network that is necessary
for supply of nutrients to the cell [28]. With an intact vascular supply, FDG
enters the tumor cells by using the same facilitated transport mechanism as
glucose (via cell surface proteins). The most common glucose transport protein
over-expressed on the tumor cell membranes is Glut-1, which is insulin independent
[28]. In-vitro studies have shown that FDG uptake is also determined by the
number of viable tumor cells within a lesion (tumor-cell density) [16, 28]. Non-tumoral
tissue such as necrotic and fibrotic tissue may reduce tracer uptake [16].
Increased cell proliferation in tumors (assessed by the mitotic rate) also
results in increased glucose utilization [28]. Tumor hypoxia will also increase
FDG uptake through hypoxia-inducible factor-1-alfa that up-regulates Glut-1
receptors [28]. The bottom line is that FDG accumulation within a tumor is
likely related to a complex interaction between the cellular energy demand and
the tumoral microenvironment [7].
Unfortunately, FDG is not a cancer specific agent and its uptake has been described in a number of inflammatory lesions including sarcoid, tuberculosis, fungal infection, and cerebral abscess [1,20]. The increased accumulation is probably related to a markedly increased rate of glycolysis within activated inflammatory cells. Delayed or dual phase imaging may help to differentiate between benign and malignant processes [27]. A persistent or increased level of FDG accumulation within a lesion on delayed imaging is indicative of a malignant process [27].
Patient preparation:
FDG imaging is performed in the fasting state to minimize competitive inhibition of FDG uptake by glucose [14]. A minimum 4 hour fast is recommended prior to initiation of the PET FDG study. A 12 hour fast may decrease accumulation by the myocardium and improve detection of mediastinal metastases in cases of lung or breast cancer. Patients with early morning exams should not eat anything after midnight. Patients with afternoon exams should eat a light breakfast with minimal carbohydrate containing foods [143]. Patients should be well hydrated for the exam (while fasting patients should try to drink at least two to three 12 ounce glasses of water) and should avoid strenuous work or exercise for 24 hours before scanning [73,143]. Some recommend that patients also be on a low carbohydrate diet for 24 hours prior to the study [143]. For head and neck cancers, use of a benzodiazepine can aid in decreasing neck muscle activity [143].
If there is a possibility of an elevated serum glucose level, a serum glucose level is obtained prior to FDG administration. FDG uptake is significantly influenced by plasma glucose levels and uptake will be decreased when plasma glucose levels are elevated (elevated serum glucose levels can result in decreased FDG accumulation within the tumors) [4,14]. If the glucose level is higher than 150-200 mg/dL, the study should be delayed until the glucose level is under 200 mg/dL [3,76]. Administering insulin at the same time as FDG should be avoided because it tends to increase accumulation in skeletal muscle and thus less FDG is available for accumulation in tumors [3]. In patients with diabetes, blood sugar control should be achieved with oral hypoglycemic agents or insulin (not administered near the time of FDG administration) [3]. Diabetic patients are best imaged early in the morning before the first meal and insulin or oral hypoglycemic medication should be titrated appropriately the night before and morning of the study [143]. If possible, diabetic patients should test their ability to maintain reasonable glucose levels after fasting prior to the PET exam [143].
For specific imaging of the kidneys or pelvic region additional preparation can be performed. A foley catheter in the bladder will aid in reducing urine activity [143]. Administration of a diuretic (lasix 20-40 mg) 10-15 minutes after FDG administration and when possible IV hydration with 250-500 mL of saline (not dextrose containing solutions) will also aid in dilution and clearance of urinary activity [143].
For oncologic imaging, FDG-PET scans are performed approximately 60 minutes following the intravenous injection of 10-20 mCi of FDG (0.14-0.21 mCi/kg of body weight) [143]. For pediatric use, a dose of 0.15-0.30 mCi/kg has been recommended with a minimum dose of 1 mCi [125]. A two dimensional (2D) acquisition is acquired from the base of the brain to the mid thighs [3]. The exam usually requires 45 minutes to 1 hour to acquire when performing attenuation corrected exams using a conventional BGO scanner [15]. LSO PET cameras can perform a similar 3D acquisition in a shorter period of time. Imaging times are also shortened when CT is used for attenuation correction.
In addition to whole body images, some centers acquire a 4-minute brain scan about 30 minutes following FDG administration using the three-dimensional acquisition mode [3]. However, routine CNS imaging is not universally performed [45]. The normal brain has substantial glucose uptake and metastatic foci may be difficult to detect on PET FDG images [42,43,44,45].
Overall efficacy:
Not all tumors will shown significant metabolic activity on FDG PET imaging [47]. PET exams are positive for tumor in about three-quarters of patients with known primary or residual tumor [47]. The results of a large number of studies has shown that the results of FDG PET imaging can have a major impact on oncologic patient management. Up to 15% of patients without clinical suspicion of recurrence or residual disease are found to have active tumor on PET imaging [47]. PET exam findings can change planned radiation therapy (dose, volume, or intent) in 27% of patients [47]. PET imaging can also detect unexpected sites of secondary malignancy (in 1.2 to 2% of patients) [75,113]. The identification of unexpected hypermetabolic foci on FDG PET imaging should prompt further evaluation as up to 71% of these foci can be malignant or premalignant [75].
One other drawback of PET imaging is the underestimation of metabolic activity in tumors that are smaller than two times the spatial resolution of the scanner (partial volume effect) [6,118]. For a spherical lesion with a diameter 1.5 times the spatial resolution of the PET scanner at full width at half maximum, the measured maximum activity concentration is only 60% of the true activity (and the measured mean activity concentration on 30% of the true activity) [118]. Despite this limitation, using modern PET scanners, objects that measure as small as 5 mm can be visualized [1]. Assessment for malignancy and metastatic disease with PET FDG imaging is improved when supplemented by CT images [2]. PET imaging can also identify a more accessible tumor site for biopsy.
In cancer screening of asymptomatic individuals, FDG PET imaging can detect unsuspected malignancy in 1.1-1.2% of patients [113]. However, PET imaging is not recommended as a screening exam.
Monitoring response to therapy:
Individual tumors will vary widely in their response to a particular form of therapy [53]. These differences are likely multifactoral and related to disparities in tumor biology and the presence of drug and radio-resistance mechanisms [53]. The early identification of tumors that are not responding to conventional therapies would permit the timely institution of alternative treatment that may be more effective [53]. Conventional imaging modalities are somewhat limited in their ability to evaluate for treatment response as residual masses may persist on imaging studies despite resolution of disease activity [53]. In other words- anatomic changes often lag behind tumor cell mortality [53]. FDG PET imaging can evaluate tumor response to therapy before anatomic changes are observed [53]. PET imaging is currently the most sensitive and specific imaging method to obtain information about tumor physiology [53]. Studies indicate that a measurable decrease in tumor FDG uptake 1-3 weeks following chemotherapy is associated with effective treatment [118]. Therefore, post-treatment imaging should be performed 2 weeks following the end of a specific chemotherapy cycle, while waiting 6-8 weeks following radiation therapy [143]. Patients who do not demonstrate a change in FDG uptake should be considered for a change in treatment regimen [118]. By providing a more timely and accurate assessment of treatment efficacy, PET imaging can have significant impact on clinical treatment decisions [53].
For proper interpretation of tumor response, it is important to have a baseline examination [53]. Imaging 1-2 weeks after completion of chemotherapy is recommended to avoid transient fluctuations in FDG metabolism [53]. For radiation therapy a longer delay may be required (up to 60 days) prior to imaging. Generally, FDG uptake 6 months after radiotherapy is associated with tumor recurrence [53]. Assessment of tumor response to therapy can be determined by visual assessment of the images or by quantitative analysis using standard uptake values [53].
Standardized uptake ratio (SUR) or standardized uptake value (SUV):
A standardized uptake ratio (SUR), also known as a standardized uptake value (SUV), is used to determine if a lesion has increased 18FDG activity. The SUR normalizes the amount of FDG accumulation in a region of interest (ROI) to the total injected dose and the patient?s body weight [60]. It provides a means of comparison of FDG uptake between patients [14]. The SUR is calculated by dividing the mean activity within a selected region of interest (in mCi/ml) by the injected dose (in mCi/kg). Modifications of the SUR that may improve the semiquantitative evaluation of FDG uptake include using body surface area or the lean body weight instead of the weight of the patient; this is significant because the distribution of FDG is higher in muscle than in fat [4]. Specifically, in pediatric patients an SUV calculation based upon body surface area seems to be a more uniform parameter than SUV determined on body weight [125].
SUR= Mean selected region activity (mCi/ml)/[injected dose (mCi)/body weight (kg)]
It is important to remember that SUR values may change with time after FDG injection; thus, the time of acquisition after FDG injection must be standardized for the values to be useful [3]. Other factors that can affect the SUR include patient motion (due to lesion blurring), the blood glucose level at the time of injection, and partial-volume effects (scanner resolution) [16, 36]. Partial volume effects represent underestimation of metabolic activity in tumors that are smaller than two times the spatial resolution of the scanner [6]. An accurate SUR determination is more difficult for nodules smaller than 1.5 cm due to partial volume effects [85].
An SUR greater than 2.5 has been shown to be very sensitive and specific for malignant lesions [37]. Visual analysis of the amount of uptake within a lesion has also been shown to be effective in differentiating benign from malignant lesions [37,38]. Uptake greater than blood pool activity (i.e.: the liver and mediastium typically have SUV's of about 2.0) indicates a malignant lesion, while activity equal to or less than mediastinal blood pool suggests a benign lesion [38]. In fact, visual analysis may be more sensitive for nodules smaller than 1.5 cm in size (although, the improved sensitivity comes at a decreased specificity) [38].
Changes in SUV have been used to monitor tumor response to therapy [126]. A change of more than 20% is generally considered outside the range of spontaneous fluctuation and to represent a true change in the glucose metabolism of the tumor mass [126]. The European Organization for Research and Treatment of Cancer recommends that an increase in SUV measurement of 25% from the baseline scan be classified as progressive disease, while a partial response is represented by a 15-25% decrease after one cycle of chemotherapy and greater than 25% after more than one treatment cycle [131]. Complete metabolic response is defined as complete resolution of FDG uptake in the tumor [147].
Factors affecting SUV measurement:
- Plasma glucose levels: High plasma glucose can decrease FDG uptake by competitive inhibition [111] and this will decrease the calculated SUV [110]. If the patients blood sugar is above 200 mg/dL the study should be postponed [111]. Chronic blood sugar elevation as seen in diabetic patients seems to have a less significant effect on tumor FDG uptake [111]. However, diabetic patients should have proper blood sugar control prior to PET imaging [111]. It is also important to note that insulin injection close to the time of FDG administration will increase skeletal muscle uptake of FDG and this can degrade scan quality by reducing the lesion-to-background ratio [111].
- Time after administration that SUV is measured- FDG uptake in malignant tumors is time dependent and often increases for up to 90 minutes or longer after tracer injection [118,128]. SUV should be measured at a fixed time following injection to ensure accuracy.
- Subcutaneous infiltration of the tracer: SUV is based upon the injected dose. Infiltration of the tracer will result in an error because of the decrease in the real dose available for distribution [110,118].
- Body weight or body surface area
- Size of the region of interest- because of partial volume effects, the measured mean tumor uptake will decrease when the size of the ROI used to define the tumor is increased [118].
- Resolution of the scanner
- Type of image reconstruction and attenuation correction: SUV measurements from filtered back projection (FBP) images underestimate the true activity concentration by about 20%- this is much greater than iterative reconstruction (IR) images which underestimate activity concentration by about 5% [83]. The discrepancy is primarily related to the way transmission data is processed- measured attenuation correction for FBP images and segmented attenuation correction for IR images [83]. The number of iterations used for ordered-subsets expectation maximization (OSEM) reconstruction can also affect the measured SUV value [107]. For max SUV the value increases systematically with a 28% increase from 5 to 40 iterations [107].
PET in Radiation Planning: See also individual tumors
The results of the PET examination can also be incorporated into radiation planning volumes [82]. However, there are several factors which affect PET images that can influence target edges or margins including partial volume effects, patient motion, image resolution, and window display level [82].
PET in Radiofrequency ablation evaluation: See also individual tumors
Following radiofrequency ablation, activity within the tumor decreases to background levels as soon as one day following the treatment [145]. However, a ring-shaped area of increased activity around the site of the tumor can be seen due to inflammatory changes surrounding the zone of necrosis [145]. This activity will decrease in intensity over time, but PET imaging may need to be delayed 6-8 weeks following RF treatment to better evaluate for treatment response [145].
The normal distribution for FDG includes:
1- Head and neck:
The cortex of the brain- there is generally very intense tracer uptake in the brain because the brains only energy source is glucose. The total uptake in the brain is approximately 6% of the injected dose [20]. Metastatic CNS lesions generally have activity similar to gray matter [24]. During whole body scanning for the evaluation of patients with primary malignancy, unsuspected CNS metastases are detected in less than 1% of patients [24]. Some metastases may demonstrate decreased activity compared to normal brain (possibly related to edema) [45]. For the identification of cerebral metastases FDG PET has a sensitivity of 75% and a specificity of 83% [45]. Between 32% to 40% of cerebral metastases seen on MR imaging will not be detected on FDG PET exams [45,46]. Lesion size is an important determinant in the ability to identify a CNS lesion of PET [45]. The likelihood of detecting a 1 cm size metastatic CNS lesion is only about 40%, while a 1.8 cm lesion has a mean detection rate of about 90% [45]. It has been found that when scanning of the brain is included for oncologic FDG PET imaging a change in treatment occurs in fewer than 1% of patients [45]. Because FDG PET imaging detects few clinically relavent lesions in patients with primary malignancies, it should not be performed routinely [24].
|
Normal brain activity: The image below demonstrates normal FDG brain activity. |
|
|
Low to moderate FDG uptake occurs in the lingual and palatine tonsils and at the base of the tongue because of physiologic activity associated with the lymphatic tissue in Waldeyer's ring [41]. However, tonsil uptake can be high (SUV 3.11 (lingual) to 3.48 (palatine)) [103]. There is usually uptake in the lymphoid tissue of Waldeyer's ring [4]. The soft palate can also show tracer uptake [103]. Variable, but typically low, uptake can be seen in the salivary glands which secrete low amounts of glucose [41]. The parotids glands also show mild, symmetric tracer uptake.
|
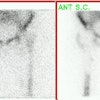
Head and neck activity: The images below show typical uptake in the tonsils (black arrows), submandibular glands (blue arrows), and parotid glands (red arrows) |
|
|
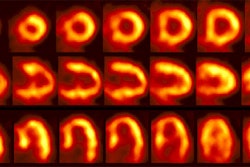
2- Myocardium- in the post-prandial state, there is marked cardiac activity. Little myocardial activity is generally noted in the fasting state as the myocardium preferentially utilizes fatty acids for energy generation. However, uptake can be variable as even in the fasting state, glucose can still account for 30-40% of the energy derived from oxidative metabolism [25]. Increased FDG uptake has also been reported in lipomatous hypertrophy of the interatrial septum- mean SUV 5.6 [101]. Uptake can be seen in up to 82% of patients with LHIS [101]. The etiology for the uptake is not certain, but may be related to the presence of brown fat [101]. Fusion PET/CT helps to clarify the location of the uptake [101].
|
Myocardial activity: Myocardial uptake can be very variable. The patient on the left below had a glucose level of 97 prior to FDG injection. Despite the normal serum glucose, note the intense cardiac activity in this patient. The patient on the right was a diabetic patient with a blood glucose of 169- note that there is no myocardial uptake in this patient despite the elevated glucose level. |
|
|
3- Renal/Urinary bladder- Unlike glucose, FDG is filtered by the glomerulus and not resorbed [54]. Hydration and frequent voiding promote diuresis and help to decrease the radiation dose to the genitourinary tract [4]. The use of IV hydration and IV lasix (0.5 mg/kg up to 40 mg with 3 successive urinary bladder voidings) can help to decrease/clear ureteral and urinary bladder activity in cases in where there are equivocal pelvic findings [153].
|
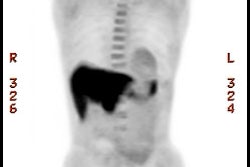
Genitourinary activity: The image below demonstrates normal renal and hepatic activity. |
|
|
|
Genitourinary activity: The image below demonstrates activity within the collecting system of a transplanted kidney (black arrows). This should not be mistaken for an abnormality. |
|
|
|
Bladder cancer: Dilute urinary activity in this patient's bladder allowed accurate detection of their bladder cancer (white arrows on CT, black arrows on PET scan). In general, urinary excretion of FDG limits evaluation of urinary tract malignancies, however, hydration and diuresis can improve diagnostic accuracy. |
|
|
4- Liver- faint, heterogeneous activity is common. It is possible for both liver metastases and treated liver metastases to have liver-equivalent activity- as a result, such lesions cannot be reliably identified by PET imaging [17]. Acute cholangitis can demonstrate foci of tracer uptake along the course of the intrahepatic ducts, but this can be difficult to distinguish from true liver lesions [39]. Uptake can also be seen along biliary stents [39].
5- Musculoskeltal and soft tissue activity:
Exercise should be avoided on the day of scanning to avoid muscle uptake. The muscles of mastication or larynx can accumulate tracer if eating or talking [4]. Asymmetric uptake of FDG can be seen in the small internal laryngeal muscles in patients with laryngeal nerve palsy contralateral to the side of the nerve dysfunction and should not be misinterpreted as pathologic [29]. In patients with COPD, intercostal muscle uptake can be seen due to excessive contraction required to facilitate expiration [111]. Hyperventilation may induce uptake in the diaphragm [54] and stress-induced muscle tension is often seen in the trapezius and paraspinal muscles [4]. Benzodiazepines may be used to decrease paraspinal and posterior cervical muscle uptake in tense patients [20]. Insulin injection just prior to FDG administration will result in increased muscle uptake [111].
|
Muscle activity: Note the marked muscle uptake within the forearms in this patient. We suspect that the patient was cold or nervous and clenching there hands following injection of the tracer. |
|
Intercostal muscle activity: Uptake appears to be within the ribs, but this actually represents uptake in the intercostal muscles in a patient with severe COPD. COPD patients use their intercostal muscles for breathing. |
|
|
A moderate amount of uptake can be seen in the anterior part of the floor of the mouth due to the genioglosus muscle which prevents the tongue from fall back in supine patients [41]. In patients that chew uptake can be seen in the masticator muscles. Speaking or coughing produces tracer uptake in larynx (pharyngeal constrictor muscles and vocal cords larynx) [127]. Asymmetric muscular uptake can be seen in the inferior obliquus capitus muscle at the skull base [127].
|
Laryngeal activity: Likely related to talking or coughing during tracer uptake. |
|
|
|
Intense uptake in the tongue: Intense tracer uptake in the tongue in this patient was likely related to nervous movement of the tongue during the tracer uptake phase. |
|
|
|
Inferior obliquus capitus muscle: The patient below presented for staging lymphoma. There was intense uptake in the posterior right neck- CT revealed this to correspond to the inferior obliquus capitus muscle [127]. The patient had torticollis which was felt to be the etiology for the asymmetric uptake in this case. |
|
|
Prominent tracer uptake has also been described within the supraclavicular fat on PET/CT in about 2% to 4% of patients- the etiology is not well understood, but is felt to be related to the presence of "brown fat" (brown adipose tissue). [52,62,67]. Brown fat is most prominent in newborns and diminishes with age [67]. Brown fat (unlike white adipose tissue fat) has the capacity to generate heat [67]. Brown fat is stimulated by several factors, including exposure to cold which causes over-expression of glucose transporter 4 in brown fat [62]. The incidence of uptake in brown fat has been shown to be increased during periods of cooler temperatures [62]. The incidence of tracer uptake in brown fat is also increased in women [62,91] and in pediatric patients [67]. Other areas in which brown fat uptake can less commonly be seen include the axillae, mediastinum, intercostal paravertebral, and perinephric regions [67,91]. Why brown fat persists in some adults is not presently known- although it is possible that brown fat may persist into adulthood more than was previously recognized [67]. Brown fat is known to increase glucose uptake when the sympathetic nervous system is activated by cold stimulation and other causes [86]. Because brown fat is stimulated by the sympathetic nervous system, pretreatment with propranolol has been shown to reduce FDG uptake in an animal model [86].
|
Brown Fat: Prominent, symmetric supraclavicular tracer uptake was seen in this patient without a corresponding CT finding. Uptake in this area has been felt to be related to the presence of "brown" fat. |
|
|
There is normal tracer uptake in the skeletal growth centers- particularly long bone physes [125]. Uptake in benign bone lesions can be seen, such as Pagets disease [39]. Benign fibro-osseous lesions such as non-ossifying fibromas, fibrous cortical defects, and cortical desmoids can also demonstrate tracer uptake [149,150]. Acute (fractures less than 3 months old [111]) or actively healing fractures also show increased FDG activity [39,92]. Sacral insufficiency fractures can also demonstrate increased tracer activity and may have a linear appearance [66]. Patients with osteoarthritis or bursitis of the shoulders can show diffuse uptake about the shoulder joint [124]. Decreased skeletal activity can be seen following radiation therapy [39].
FDG uptake around the head and neck of hip prosthesis can commonly be seen in non-infected prostheses [49] (whereas increased tracer uptake along the interface between the bone and the prosthesis is suggestive of infection [50]). The artifact is related to differences in density at the interface between the metal prosthesis (high density) and the surrounding soft tissues (low density) [51]. Because of partial volume effects, the scanner records information along this interface as an average of the two densities [51]. This leads to over-correction of the low density soft-tissues adjacent to the prosthesis [51]. This finding can be caused by motion (even of only a few millimeters) between the emission and transmission scans [51]. The use of attenuation-weighted iterative image reconstruction can minimize this finding [51]. Also, this artifact should not be present on non-attenuation corrected images [51].
|
Peri-prosthetic activity: The patient below had a left hip prosthesis. The PET scan was performed for the evaluation of a lung nodule. The patient had no symptoms referable to the left hip. Note the increased activity along the margins of the neck and head portions of the prosthesis. This finding can be seen normally and should not be considered evidence of infection. |
|
|
|
Peri-prosthetic activity: The patient below had bilateral hip prostheses. Note how the periprosthetic tracer uptake (black arrows) becomes less conspicuous on the non-attenuation corrected images (right). |
|
|
Similar to other nuclear medicine examinations, an intra-arterial tracer injection will result in a "glove phenomenon" with significant activity in limb distal to the arterial injection site.
|
Arterial injection: The patient below had an accidental arterial tracer injection. Note the significant increased activity in the left arm below the site of the injection. |
|
|
6- Gastrointestinal tract- variable activity can be seen in the GI tract- partly due to smooth muscle activity associated with peristalsis, bacterial uptake, gastrointestinal lymphoid tissue, and metabolically active mucosa [20,30,54,95]. Small bowel activity is usually heterogeneous and of low intensity [156]. Inflammatory conditions such as Crohn's disease can produce areas of increased tracer activity [156]. Large bowel activity is common and can be focal, segmental, or diffuse [40]. Focal intense uptake in the colon is an uncommon finding (1-2% of cases) and should be further evaluated with colonoscopy to exclude a neoplastic process which can be found in a large percentage of patients (61 to 86% of focal abnormalities are found to be premalignant or malignant) [40,93,96,114,123]. Acute diverticulitis is an inflammatory condition that can result in focal colonic uptake [96]. Segmental colonic uptake is usually related to inflammation, while diffuse uptake is usually not associated with underlying bowel abnormality [40]. Uptake in the cecum and right colon is usually higher than in other colonic segments [4,40]. This may be related to abundant lymphoid tissue in this region [54]. FDG accumulation can also often occur in segments or large sections of the colon after colonoscopy- possibly due to a non-specific inflamation [20].
|
Normal bowel activity: Faint heterogeneous bowel
uptake is common. |
|
|
|
Intense right colon activity: Note the intense activity in the right colon in this asymptomatic patient. Increased activity in the right colon can sometimes be seen. Note uptake in the patients left upper lobe lung cancer. Focal activity in the left upper abdomen was related to the stomach. |
|
|
|
Diffuse large bowel activity: Diffuse increased colonic FDG uptake was seen in this asymptomatic patient. Diffuse uptake is usually not associated with underlying bowel abnormality. |
|
|
|
Focal colonic uptake associated with colon cancer: This patient had focal tracer uptake in the region of the cecum. CT demonstrated a soft tissue mass which was found to be a primary colon cancer on colonoscopy. Focal areas of colonic tracer uptake should be further evaluated. |
|
|
|
Segmental colon activity in diverticular disease: Note the segmental FDG uptake corresponding to an area of severe diverticular disease on CT. There is likely underlying inflammation or muscular spasm which contributes to the FDG uptake.. |
|
|
The stomach is usually faintly seen (but uptake can be intense) - activity is seen only in the wall of the stomach (possibly related to smooth muscle activity) giving it a "ring-like" appearance [4,99,111]. However, if the stomach is not distended, uptake can appear focal- particularly in patients with prior partial gastric resection surgery [116]. Drinking a glass of water will produce gastric distention and benign uptake will generally become less conspicuous [116]. Focal gastric uptake should prompt further evaluation to exclude an underlying mass [156].
|
Gastric activity: Gastric activity can be very intense- even in patients without gastrointestinal disease. Note the "ring-like" appearance of normal gastric activity. |
|
|
There can be normal mild FDG activity in the esophagus possibly due to swallowed saliva or smooth muscle activity and this can potentially obscure subtle lesions [11]. If the uptake in the distal esophagus is linear, but moderate to intense in activity- further evaluation should be performed to exclude Barrett esophagus [156]. There is usually a focus of moderate FDG uptake at the gastroesophageal junction- most likely related to normal contraction of the lower esophageal sphincter (which prevents reflux) [111]. Esophagitis in the distal esophagus is also a common cause of tracer accumulation [4]. However, even in patients without a specific history of esophagogastric disease, the gastric or gastroesophageal junction SUV can be as high as 4.0 (values higher than this should prompt further evaluation)[99].
|
Esophageal activity: The image below demonstrates non-specific esophageal activity which appears as linear uptake anterior to the spine (black arrows). |
|
|
|
Ostomy sites: Tracer uptake at ostomy sites is
common. |
|
|
For examinations that are co-registered with CT imaging, oral contrast can aid in confirming activity is located within bowel [30]. Oral contrast administration is associated with some increased FDG uptake in the ascending colon [30]. Also- because the contrast agent is traveling through the bowel the CT data may not exactly represent the distribution of contrast at the time of the FDG exam [30]. In principle, a mismatch of low CT density at the time of CT data acquisition and high CT contrast density at the time of FDG imaging could result in an artificially reduced FDG activity on attenuation corrected images [30].
7- Thymus: Thymic uptake is commonly seen in children (up to 73% of children prior to chemotherapy) [98]. However, not all children will have visible thymic activity on FDG imaging [19]. The cause of this variability in pediatric thymic accumulation of FDG is unclear, but is likely related to physical and emotional stressors which influence thymic metabolism [19]. In general, physiologic uptake of FDG in the thymus disappears in adolescence in conjunction with involution of the thymus [19]. However, physiologic uptake in the thymus can be seen in patients well beyond puberty [98] and thymic FDG accumulation can also be seen in adult patients with a normal thymus [48].
Thymic hyperplasia is one etiology for physiologic FDG accumulation in the thymus [98]. Thymic hyperplasia represents an immunologic rebound phenomenon following chemotherapy which is especially seen in young patients treated for malignancy [98]. Following chemotherapy, thymic FDG uptake can be seen in 75% of children and in 5% to 16% of adults [4,7,8,19,98]. Thymic enlargement can persist for up to 6 months following completion of chemotherapy [7].
There are several clues to non-pathologic thymic FDG accumulation. Normal thymic activity is usually triangular or "V" shaped (bilobed) and generally not very intense [98]- uptake values are typically less than 2.5 [48]. On anatomic imaging studies, the thymus should also have a normal appearance [98]. Lack of uptake on the pre-therapy scan should be a clue to post-treatment thymic hyperplasia [98].
FDG accumulation in the thymus suggests pathology when it does not have a typical triangular shape or if the activity is very intense (SUV max greater than 4.0 [98]) [19].
8- Bone marrow- faint activity is generally identified within the bone marrow [7]. The accumulation is generally homogeneous and has SUV ratios between 0.7 to 1.3 [7]. Bone marrow activity that is greater in intensity than the liver is considered abnormal [39]. Increased bone marrow activity can be seen with bone marrow recovery following chemotherapy, but this usually resolves by one month post-therapy [4]. Treatment with granulocyte stimulating factors (Filgrastim [Neupogen- daily dose] and Pegfilgrastim [Neulasta- single dose]) can also produce diffuse skeletal FDG accumulation [9,142] which can interfere with accurate PET imaging by decreasing the bioavailability of FDG to the tumor [79,142]. Both agents also result in increased splenic FDG accumulation [142]. Elevated marrow activity may persist in some patients for up to 20 days in some patients [79]. Both agents also result in increase splenic FDG accumulation [142]. Separating PET imaging from short acting colony stimulating factor therapy by a minimum of 5 days is recommended [79] and up to 30 days may be required for long acting agents [147].
Radiation treatment can also affect marrow activity. In an animal model following XRT, the irradiated bone marrow shows a significant increase in FDG accumulation over baseline on day 1, a significant decrease on day 9, and a return to normal between 18 and 30 days [12,13].
|
Marrow activity: The images below are from two separate patients each showing mild FDG accumulation within the vertebral bodies. |
|
|
|
Growth colony effect: The patient shown below had received growth colony stimulating factor (GCSF). Note the extensive increased marrow activity. Note increased splenic activity also seen as a result of GCSF therapy. Click image to view rotating avi file. |
|
|
9- Thyroid- incidental uptake of FDG in the thyroid can be seen in about 2% to 4.3% of scans [31,120,140]. Diffuse thyroid uptake can occur in association with thyroiditis or Graves' disease and is generally felt to be a benign finding [140]. Focal thyroid uptake can occur with autonomously functioning thyroid nodules and thyroid malignancies. Patients with focal uptake should be further evaluated due to a higher risk of the finding being associated with thyroid malignancy (27-57% risk for malignancy) [31,112,120,140].
|
Normal thyroid activity: Symmetric thyroid tracer uptake can be seen is some patients. |
|
|
10- Lymph nodes- nodal uptake can occur if the agent extravasates into the soft tissues at the site of injection (always inject in arm opposite primary lesion) [4]. Lymphoid tissue can also demonstrate significant uptake- particularly the tonsils and adenoids [20]. Nodal uptake is also seen in patients with sarcoidosis- probably related to activated macrophages within granulomas [80,81]. In sarcoid, the degree of uptake has been related to disease activity and to document response to therapy [80,81].
11- Gonads/Ovary/Uterus/Endometrium- Male gonadal activity can be seen and is quite variable. Faint uterine activity is common. In premenopausal patients, greater endometrial accumulation can be seen in the uterus during menstruation and ovulation (mid-cycle) [20,77]. Uptake is lower during the proliferative and secretory phases [77]. This is because the first half of the uterine cycle is characterized by increased glycolysis under the stimulation of estrogen and glycogen synthetase, while the second half is characterized by breakdown of glucose under glycogen phosphorylase activity [129]. Mild endometrial activity can be seen in post-menopausal women (mean endometrial SUV is about 1.7 +/- 0.5) and does not seem to be significantly affected by hormone or anti-breast cancer hormone therapy [77]. Increased ovarian uptake can be normal in premenopausal patients and is associated with ovulation [77]. Ovarian uptake in post-menopausal women is associated with malignancy and should always prompt further evaluation [77].
|
Normal uterine activity: Faint uterine uptake is common (black arrows). |
|
Normal testicular activity: Mild symmetric testicular uptake can be seen (black arrows). |
|
|
12- Degenerative joint disease and degenerative disk disease can be associated with increased tracer accumulation [146]. Incidental uptake suggestive of degenerative changes in the spine can be seen in up to 22% of patients [146]. The lumbosacral spine is the most common location and the severity of uptake correlates with the severeity of the degenerative changes noted on CT [146]. The FDG accumulation is likely related to the inflammatory process that accompanies degenerative joint disease [146]. PET/CT aids in proper localization of the uptake so that it is not mistaken for metastatic disease [146].
13- Vascular activity- in scans not corrected for transmission, vascular activity in the large vessels in the thighs and pelvis can be seen in about 80% of patients [10]. On attenuation corrected images mild vascular acitivity can be seen in association with severe atherosclerotic disease or aneurysms [39]. Vascular uptake may reflect active atherosclerosis [68] and is probably related to the presence of macrophages [89,97,119]. Vascular uptake is also seen in association with thrombophlebitis (which can be very intense) [39] and vasculitis [97,115]. Vascular grafts also demonstrate mild tracer accumulation as do sites of endarterectomy [39]. Injections performed via a port-a-cath will show retained activity in the hub and also along the course of the catheter [39].
|
Normal vascular activity: Faint activity can be seen in the descending thoracic aorta (black arrows) |
14- Breasts- Any focal area of increased tracer accumulation in the breast should prompt further evaluation to exclude an underlying malignancy [144]. Variable uptake can be seen within glandular tissue [20,61]. Higher FDG uptake is seen in women with dense breasts (larger amount of glandular tissue) and in women on hormone replacement [61]. The maximum peak SUV observed in dense breasts can be as high as 1.39, although the average SUV is typically less than 0.50 [61]. The nipples also normally demonstrate FDG activity- especially on non-attenuation corrected images [111]. High uptake of FDG can be seen in the lactating breast due to intracellular trapping within active glandular tissue [21]. There is low excretion of FDG into breast milk and the estimated cumulative dose to a breast fed infant is approximately 0.085 mSv (well below the 1 mSv recommended for cessation of breast-feeding) [21]. Although the amount of radioactivity within breast milk is low, the retained activity within the breast poses a direct and significant source of radiation exposure to the nursing infant [21]. Although it is not necessary to stop breast feeding following an FDG exam, close contact with the infant should be avoided [21].
|
Normal breast activity: Faint activity can normally be seen in the breasts (black arrows) |
|
|
15- Spleen- Diffusely increased splenic FDG uptake can be seen in association with granulocyte colony-stimulating factor treatment [32,33].
16- Benign adrenal lesions: Benign adrenal adenomas and adrenal myelolipomas can have uptake of FDG equal to or greater than the liver resulting in a false positive exam in (about 5% of adrenal adenomas demonstrate false positive findings) [135,137,155]. A cutoff SUV of 3.1 has been shown to have a sensitivity of 98.5% and a specificity of 92% for characterization of malignant adrenal lesions [136]. However- false negative exams can occur with neuroendocrine metastases, small lesions, and necrotic/hemorrhagic lesions [135,155]. Generally, however, adenomas demonstrate only mild tracer accumulation that is less than liver activity, but greater than background [135], whereas malignant lesions will show uptake that is greater than liver activity [155]. The use of PET/CT can improve characterization of adrenal masses by improving the exams specificity [136,155]. PET/CT permits further characterization of the lesion with an HU measurement of less than 10 indicative of a benign adrenal lesion [136,137,155].
|
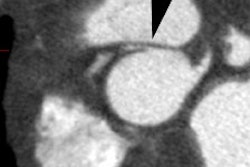
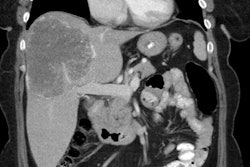
Benign adrenal lesion with FDG uptake: The patient shown below had a left adrenal mass which had remained stable for 2 years (white arrow). The stability over time and CT features would be consistent with a benign adrenal lesion- likely an adenoma. Note the marked FDG uptake within the mass on PET imaging (black arrows). Benign adrenal adenomas can accumulate FDG resulting in false positive exams. The use of PET/CT has been shown to improve the specificity of the PET exam. |
|
|
17- Inflammation- FDG accumulation can be seen at sites of inflammation. The increased accumulation is probably related to a markedly increased rate of glycolysis within activated inflammatory cells. Talc pleurodesis produces a visceral and parietal pleural granulomatous inflammation. Increased FDG activity has been reported in sites of pleural talc (up to 3 years following the procedure)- presumably secondary to pleural inflammation [71,72]. Diffuse increased FDG accumulation in the lungs can be seen in association with bleomycin pulmonary toxicity [104].
Mesh used for hernia repairs can also be associated with FDG accumulation and can be seen for several years (SUV max 2.8 to 5.6) [108]. The uptake is likely associated with a foreign body granulomatous reaction and it seems to be more intense with polypropylene mesh compared to polytetrafluoroethylene mesh [108].
|
Inflammation: The image below demonstrates ring-like increased tracer activity surrounding the gallbladder in a patient with cholecysitis (black arrows). Note the gallbladder wall thickening and adjacent inflammatory changes seen on the patient's CT scan (white arrows). |
|
|
Other agents used for oncologic imaging:
18F-Fluoride:
18F-Fluoride is a bone imaging agent used for PET [78]. After diffusing into the extracellular fluid of bone, the fluoride ion is exchanged for a hydroxyl group on the hydroxyapatite crystal bone and forms fluoroapatite which then deposits on the bone surface [78,122]. Bone uptake of the fluoride ion is two-fold higher than that of 99mTc-polyphosphonates and because it is not protein bound there is faster blood clearance (resulting in a better target-to-background ratio) [78,122]. The spatial resolution of 18F-fluoride is also superior to standard bone scanning [78].
18F-Fluoride is very sensitive for the detection of both lytic and sclerotic bone lesions, however, the agent is not tumor specific and benign bone lesions (degenerative change, fractures, Pagets disease, enchondroma, and osteoma) will also demonstrate increased tracer uptake [78]. Improved specificity is seen when the 18F-fluoride scan is interpreted with a fused CT exam [78,133].
Scanning is performed 45 minutes after the injection of 8-12 mCi of 18F-fluoride [78].
Somatostatin receptor imaging agents:
Gluc-Lys ([18F]FP)-TOCA:
Gluc-Lys ([18F]FP)-TOCA is an agent that can be used for somatostatin receptor imaging [139]. [111In]DTPA-octreotide imaging is limited by delayed imaging, high physiologic uptake in the liver and kidneys, and the low spatial resolution of SPECT imaging [139]. ([18F]FP)-TOCA has low lipophicity, rapid renal tracer elimination, low liver and intestinal uptake, and rapid tumor uptake (by about 30 minutes) resulting in excellent tumor-to-non-tumor ratios [139]. Imaging should be initiated between 30-40 minutes following tracer injection [139]. Whole body radiation exposure is about 1.3 mSv/100MBq (compared to 8 mSv/100 MBq with [111In]DTPA-octreotide) [139]. In a comparison with [111In]DTPA-octreotide imaging, PET detected over twice as many lesions [139]. The drawbacks of the agent are that it requires a long multi-step preparation and there is limited radiochemical yield (20-30%) [139].
Amino Acids:
Amino acid transport and protein synthesis are generally increased in malignant cells and amino acid imaging is less influenced by inflammation [18,56]. The replacement of a carbon atom by 11C does not chemically change the molecule [18]. Amino acid agents typically have low CNS uptake which provides good contrast with tumor uptake (compared to FDG which has significant CNS activity) [18]. Images are usually performed within the first hour after tracer administration and patients should be fasting prior to the exam [18]. However, the optimal dietary state for imaging has not yet been clearly defined and tumor uptake of certain amino acids may be promoted by preloading with other amino acids such as tryptophan [34]. Tumor hypoxia decreases uptake of amino acids (unlike FDG uptake which is increased by tumor hypoxia) [26].
18F-fluorodeoxythymidine:
Tumor growth rate is a useful prognostic indicator of tumor aggressiveness and tumor response to therapy [70]. Cell lines and tissues with a high proliferation rate require high rates of DNA synthesis [70]. PET imaging can be used to measure tumor cell proliferation using thymidine analogs.
18F-fluorodeoxythymidine (18F-FLT) is an amino acid agent labeled with 18F that can be used to measure tumor cell proliferation [35,63]. The agent is transported into the cell by the same nucleoside carriers as thymidine [84]. The agent is then phosphylated within the cell by thymidine kinase-1 (TK1) which is upregulated in rapidly dividing tumor cells especially during the S-phase of the cell cycle (thymidine kinase activity is a marker of cellular proliferation) [35,69,151]. There is prolonged intracellular retention of 18F-fluorodeoxythymidine because it is polar and cannot cross the cell membrane and it is also very resistant to catabolism by thymidine phosphorylase [35]. Only minimal amounts of 18F-FLT is incorporated into DNA (less than 1%) because the agent lacks a 3'-hydroxyl group which is essential for chain propagation [100,102,152]. FLT anabolism occurs primarily in the liver to produce a glucuronide conjugate that is exported to the blood and cleared by the kidneys [152].
Imaging is started approximately 60 minutes following tracer administration [138]. The organs receiving the largest radiation dose from 18F-FLT are the urinary bladder (abour 650 mrad/mCi) and the liver (about 200 mrad/mCi) [65]. The effective dose equivalent is about 100-120 mrad/mCi [65].
18F-FLT has limited ability to image the bone marrow (because of intense uptake associated with normal cellular proliferation) and the liver (because of glucuronidation) [64,69]. Minor intestinal uptake can be observed [69]. Generally, there is no uptake within the brain or myocardium [69,94]. Therefore, FLT may be more favorable than FDG for imaging brain metastases [109]. However, uptake of 18F-FLT within malignant lesions appears to be less than 18F-FDG uptake and there is an increased risk for false negative exams [63,138]. Unfortunately, due to it's lower sensitivity compared to FDG, FLT is not useful for staging and restaging lung cancer [94,138] and esophageal cancer [105]. However, 18F-FLT appears to have utility in the imaging of CNS neoplasms due to its low basal CNS uptake which allows better delineation of lesions compared to FDG CNS imaging [117]. See also CNS tumor imaging
Unlike FDG, there is little accumulation of FLT in areas of inflammation [84]. However, accumulation at inflammatory sites has been reported and can lead to false positive exams [138]. Inflammatory lung disease can be associated with lymphocytic infiltrates and involve growth factors that lead to increased proliferation [138]. FLT accumulation at sites of inflammation appears to be related to two factors: 1) Proliferation of lymphocytes; and 2) Nonspecific increased accumulation due to increased perfusion and vascular permeability [138].
18F-fluoro-L-tyrosine:
18F-fluoro-L-tyrosine (18F-TYR) is an agent that can be used to assess the rate of protein synthesis within malignant lesions [56]. The agent is not actually incorporated into proteins, but exhibits high uptake in tumor cells due to increased transport via the amino acid transport system [106,132]. The agent has low uptake in inflammatory conditions thus promising a higher specificity for the detection of malignancy [106,132]. There is high uptake in the pancreas, the salivary glands, and to a lesser extent within the liver which can hamper detection of lesions in these areas [56]. FDG PET imaging is superior to 18F-TYR for staging NSCLC, head and neck tumors, and lymphoma [56,132]. Overall, 18F-TYR has been shown to be inferior to FDG for general tumor evaluation [106].
18F-fluorodihydroxyphenylalanine (DOPA):
18F-FDOPA is an agent being explored for imaging of neuroendocrine tumors [87]. The agents use is based on the capacity of endocrine tumor cells to take up, decarboxylate, and store amino acids such as dihydroxyphenylalanine [148]. For the examination, patients should fast for at least 6 hours prior to the study [148]. The dose is 5MBq/kg body mass. Immediately following injection a set of images over the abdomen is obtained prior to excretion of FDOPA by the biliary tree which is seen on images obtained after 1 hour [148]. Normal tracer uptake can be seen in the striatum and pancreas, and there is elimination via the biliary, digestive, and urinary tracts [148]. The agent has demonstrated superior performance for lesion identification compared to somatostatin receptor scintigraphy (overall sensitivity for 18F-FDOPA about 85% compared to 58% for SRS) [87]. 18F-FDOPA has been shown to be superior to CT in the detection of skeletal metastases [87]. 18F-FDOPA exam findings can alter patient management in up to 30% of cases [87]. 18F-FDOPA has also been shown to be highly accurate for the evaluation of CNS neoplasms [141].
11C-L-methylmethionine:
11C-L-methylmethionine measures amino acid uptake/protein synthesis (tumor cells require an external supply of methionine). Methionine is needed for protein synthesis as a precursor of S-adenosylmethionine which is required for polyamine synthesis [55]. Increased uptake of methionine reflects increased carrier mediated transport, transmethylation rate, and protein synthesis in malignant tissue [55,130]. The agent has primarily been used for imaging of CNS neoplasms [18]. There is normally low uptake in the brain (gray matter), and somewhat higher uptake in the salivary glands, lacrimal glands, bone marrow, and occasionally the myocardium [18]. Abdominal uptake in the liver and pancreas (usually high uptake) is frequently seen, and there is variable intestinal uptake of the agent [18]. Moderate activity is seen in the renal cortex [18]. Pituitary uptake is high [18].
11C-thymidine:
11C-thymidine is used in the evaluation of tumor DNA replication and cell division rates. 68Ga-EDTA has been used in the evaluation of disruption of the blood brain barrier.
11C-choline:
11C-choline (11C-CHOL) is an agent that is incorporated into tumor cells by conversion into 11C-phosphorlycholine which is trapped inside the cell. This is followed by synthesis of 11C-phosphatidylcholine which constitutes a main component of cell membranes [26]. Because tumor cells duplicate very quickly, the biosynthesis of cell membranes is also very fast and there is increased uptake of choline and upregulation of the enzyme choline kinase [26]. Essentially, the uptake of 11C-CHOL in tumors represents the rate of tumor cell proliferation [5]. 11C-CHOL is very rapidly cleared from the blood, and optimal tumor-to-background contrast is reached within 5 minutes [26,59]. The initial high uptake remains at a nearly constant level afterward [59]. There are two mechanisms of tracer uptake: energy dependent choline-specific transport and simple diffusion [59].
Prominent tracer uptake is seen in the liver, renal cortex, and salivary glands (the liver and kidney are major sites for choline oxidation) [26]. Less intense uniform tracer uptake can be seen in then lungs, spleen, skeletal muscles, bone marrow, choroid plexus, and pituitary gland [26]. High to variable pancreatic and duodenal uptake can be seen due to secretion of phospholipid-rich pancreatic juice [26,59]. Variable uptake is seen in the small bowel and urinary bladder [26]. Generally, there is only minimal activity in the urinary tract and bladder of fasting individuals which may aid in the evaluation of pelvic malignancies [59]. No uptake is generally observed in the mediastinum or myocardium [26]. Since normal brain cells are in a non-dividing state, the uptake of 11C-CHOL is very low, while brain tumors and metastases have increased cell membrane synthesis and increased tracer uptake [59]. The agent is superior to FDG-PET imaging for the detection of brain metastases from lung cancer [26]. Tracer uptake can occur in inflammatory processes such as pelvic inflammatory disease [59].
11C-acetate:
11C-acetate is another PET tumor imaging agent. The mechanism of uptake is uncertain, but may be multifactoral [57] and related to low oxygen consumption and enhanced lipid synthesis in tumor cells [88]. Acetate is not only a metabolic substrate of beta-oxidation, but also a precursor of amino acids, fatty acids, and sterol [58]. The agent may be involved with active basal lipid metabolism in the cell membrane in cancer tissue with low oxidative metabolism and high lipid synthesis [57,58]. Preliminary studies have indicated that certain prostate tumors prefer 11C-acetate to FDG as a substrate for cellular metabolism [88].
The agent accumulates in the heart, kidneys, liver, pancreas, spleen, stomach, bowel, and bone marrow [88]. Urinary excretion is not seen, although mild bladder activity may be observed [57].
Tumor hypoxia agents:
Hypoxic cells are more resistant to radiation therapy and therefore require additional radiation to achieve adequate cytotoxicity [74,76,134]. In general, patients with tumors that have significant hypoxia have a worse prognosis and shorter disease free survival when compared to better oxygenated tumors [134,154]. Radiolabeled nitroimidazoles can be used for the evaluation of tumor hypoxia [134]. The agents are metabolized by intracellular nitroreductases and become trapped within hypoxic, yet metabolically active cells [134]. Nitroimidazoles bind to cells at a rate that is maximal under conditions of severe hypoxia (less than 0.05% oxygen) and are inhibited as a function of increasing oxygen concentration [134]. The metabolism of the agent requires active electron transport and therefore the agent is not incorportaed into necrotic tissue [134]. 18F-fluoromisonidazole (18F-FMISO) is a PET tracer used for the evaluation of tissue hypoxia [134,154]. 18F-FMISO acts as a bioreceptor molecule and is incorporated into cell constituents under hypoxic conditions [74]. The uptake of the agent is increased only when tissue hypoxia of < 10 mm Hg is present [154]. Unfortunately, there is slow cellular uptake and slow washout from non-hypoxic tissues which limit the effectiveness of this agent [74]. 62Cu-ATSM is another tumor hypoxia agent which accumulates in hypoxic tissues where it is reduced, and undergoes rapid clearance from non-hypoxic tissue [74,76]. [134]
REFERENCES:
(1) J Nucl Med 1994; Larson SM. Cancer or inflammation? A holy grail for nuclear medicine.
35 (10): 1653-55 (No abstract available)
(2) AJR 1998; Eubank WB, et al. Imaging of oncologic patients: Benefit of combined CT and FDG PET in the diagnosis of malignancy. 171:1103-10
(3) J Nucl Med 1999; Coleman RE. PET in lung cancer. 40: 814-820
(4) J Nucl Med 1999; Delbeke D. Oncological applications of FDG PET imaging: Brain tumors, colorectal cancer, lymphoma, and melanoma. 40: 591-603
(5) J Nucl Med 2000; Hara T, et al. Sensitive detection of mediastinal lymph node metastasis of lung cancer with 11C-Choline PET. 41: 1507-1513
(6) Radiology 1997; Moog F, et al. Lymphoma: role of whole-body 2-deoxy-2-[F-18]fluoro-D-glucose (FDG) PET in nodal staging. 203: 795-800
(7) Blood 1999; Jerusalem BG, et al. Whole-body positron emission tomography using 18-F-Fluorodeoxyglucose for posttreatment evaluation in Hodgkin's disease and non-Hodgkin's lymphoma has higher diagnostic and prognostic value than classical conventional tomography scan imaging. 94 (2): 429-433 (No abstract available)
(8) Acta Oncol 1999; Bangerter M, et al. Positron emission tomography with 18-Fluorodeoxyglucose in the staging and follow-up of lymphoma in the chest. 38 (6): 799-804
(9) J Nucl Med 1999; Moog F, et al. FDG PET can replace bone scintigraphy in primary staging of malignant lymphoma. 40 (9): 1407-13
(10) The normal PET scan. von Schulthess GK, et al. In- Clinical positron emission tomography. Correlation with morphological cross-sectional imaging. Ed. von Schulthess GK. Lippincott Williams & Wilkins. 2001: 49-69.
(11) Radiographics 2000; Skehan S, et al. Imaging features of primary and recurrent esophageal cancer at FDG PET. 20: 713-723
(12) J Nucl Med 2000; Higashi T, et al. Evaluation of the early effect of local irradiation on normal rodent bone marrow metabolism using FDG: Preclinical PET studies. 41: 2026-2035
(13) J Nucl Med 2000; Ballinger JR. Local and distant effects of radiotherapy on FDG accumulation in bone marrow. 41: 2036-37 (No abstract available)
(14) Thorax 1998; Lowe VJ, Naunheim KS. Current role of positron emission tomography in thoracic oncology. 53: 703-712
(15) Ann Thorac Surg 1998; Lowe VJ, Naunheim KS. Positron emission tomography in lung cancer. 65: 1821-29
(16) J Nucl Med 2001; Avril N, et al. Glucose metabolism of breast cancer assessed by 18F-FDG PET: Histologic and immunohistochemical tissue analysis. 42: 9-16
(17) J Nucl Med 2001; Dimitrakopoulou-Strauss A, et al. Quantitative PET studies in pretreated melanoma patients: A comparison of 6-[18F] Fluoro-L-Dopa with 18F-FDG and 15O-water using compartment and noncompartment analysis. 42: 248-256
(18) J Nucl Med 2001; Jager PL, et al. Radiolabeled amino acids: Basic aspects and clinical applications in oncology. 42: 432-445
(19) J Nucl Med 2001; Brink I, et al. Increased metabolic activity in the thymus gland studied with 18F-FDG PET: Age dependency and frequency after chemotherapy. 42: 591-595
(20) J Cancer Res Clin Oncol 2000; Ilknur AK, et al. Positron emission tomography with 2-[18F] fluoro-2-deoxy-D-glucose in oncology: Part II: The clinical value in detecting and staging primary tumours. 126: 560-574
(21) J Nucl Med 2001; Hicks RJ, et al. Pattern of uptake and excretion of 18F-FDG in the lactating breast. 42: 1238-1242
(22) J Nucl Med 2001; Higashi K, et al. Comparison of [18F]FDG PET and 201Tl SPECT in evaluation of pulmonary nodules. 42: 1489-1496
(23) J Nucl Med 2001; Mochizuki T, et al. FDG uptake and glucose transporter subtype expressions in experimental tumor and inflammation models. 42: 1551-1555
(24) Radiol Clin N Am 2001; Hagge RJ, et al. Positron emission tomography. Brain tumors and lung cancer. 39: 871-881
(25) J Nucl Cardiol 2001; Dilsizian V, et al. Fluorine-18-deoxyglucose SPECT and coincidence imaging for myocardial viability: Clinical and technical issues. 8: 75-88 (No abstract available)
(26) J Nucl Med 2002; Pieterman R, et al. Comparison of 11C-choline and 18F-FDG PET in primary diagnosis and staging of patients with thoracic cancer. 43: 167-172
(27) J Nucl Med 2002; Higashi T, et al. Relationship between retention index in dual-phase 18F-FDG PET , and hexokinase-II and glucose transporter-1 expression in pancreatic cancer. 43: 173-180
(28) J Clin Oncol 2002; Bos R, et al. Biologic correlates of 18Fluorodeoxyglucose uptake in human breast cancer measured by positron emission tomography. 20: 379-387
(29) Radiology 2002; Kamel EM, et al. Recurrent laryngeal nerve palsy in patients with lung cancer: detection with PET-CT image fusion- report of six cases. 224: 153-156
(30) AJR 2002; Dizendorf EV, et al. Application of oral contrast media in coregistered positron emission tomography- CT. 179: 477-481
(31) Surgery 2001; Cohen MS, et al. Risk of malignancy in thyroid incidentalomas identified by fluorodeoxyglucose-positron emission tomography. 130: 941-946
(32) J Nucl Med 1999; Sugawara Y, et al. Splenic fluorodeoxyglucose uptake increased by granulocyte colony-stimulating factor therapy: PET imaging results. 40: 1456-62
(33) Clin Nucl Med 1999; Abdel-Dayem HM, et al. Fluorine-18 deoxyglucose splenic uptake from extramedullary hematopoiesis after granulocyte colony-stimulating factor stimulation. 24: 319-322
(34) J Nucl Med 2002; Jager PL. Improving amino acid imaging: hungry or stuffed? 43: 1207-1209 (No abstract available)
(35) J Nucl Med 2002; Rasey JS, et al. Validation of FLT uptake as a measure of thymidine kinase-1 activity in A549 carcinoma cells. 43: 1210-1217
(36) J Nucl Med 2002; Matthies A, et al. Dual time point 18F-FDG PET for the evaluation of pulmonary nodules. 43: 871-875
(37) Radiographics 1998; Frasmus JJ, et al. Thoracic FDG PET: state of the art. 18: 5-20.
(38) J Clin Oncol 1998; Lowe VJ, et al. Prospective investigation of positron emission tomography in lung nodules. 16: 1075-84
(39) GE PET Masters Series Clinical PET; Delbeke D. Verbal communication. Sept 18-20, 2002
(40) Radiology 2002; Tatlidil R, et al. Incidental colonic fluorodeoxyglucose uptake: correlation with colonoscopic and histopathologic findings. 224: 783-787
(41) AJR 2002; Goerres GW, et al. Positron emission tomography and PET CT of the head and neck: FDG uptake in normal anatomy, in benign lesions, and in changes resulting from treatment. 179: 1337-1343 (No abstract available)
(42) Radiology 1999; Marom EM, et al. Staging non-small cell lung cancer with whole-body PET. 2121: 80-809
(43) Ann Thorac Surg 1999; Saunders CAB, et al. Evaluation of fluorodeoxyglucose whole body positron emission tomography in the staging of lung cancer. 67: 790-97
(44) Radiol Clin N Am 2001; Hagge RJ, et al. Positron emission tomography. Brain tumors and lung cancer. 39: 871-881
(45) Radiology 2003; Rohren EM, et al. Screening for cerebral metastases with FDG PET in patients undergoing whole-body staging of non-central nrevous system malignancy. 226: 181-187
(46) Radiology 1993; Griffeth LK, et al. Brain metastases from non-central nervous system tumors: evaluation with PET. 186: 37-44
(47) J Nucl Med 2003; Dizendorf EV, et al. Impact of whole-body 18F-FDG PET on staging and managing patients for radiation therapy. 44: 24-29
(48) AJR 2003; Wittram C, et al. Thymic enlargement and FDG uptake in three patients: CT and FDG positron emission tomography correlated with pathology. 180: 519-522
(49) Eur J Nucl Med Mol Imaging 2002; Zhuang H, et al. Persistent non-specific FDG uptake on PET imaging following hip arthroplasty. 29:1328-33
(50) Nucl Med Commun 2002; Chacko TK, et al. The importance of the location of fluorodeoxyglucose uptake in periprosthetic infection in painful hip prostheses. 23:851-5
(51) Radiology 2003; Goerres GW, et al. Artifacts at PET and PET/CT caused by metallic hip prosthetic material. 226: 577-584
(52) J Nucl Med 2003; Cohade C, et al. Uptake in supraclavicular are fat ("USA-fat") description on 18F-FDG PET/CT. 44: 170-176
(53) J Nucl Med 2003; Kostakoglu L, Goldsmith SJ. 18F-FDG PET evaluation of the response to therapy for lymphoma and for breast, lung, and colorectal carcinoma. 44: 224-239
(54) Radiographics 2003; Kostakoglu L, et al. Clinical role of FDG PET in evaluation of cancer patients. 23: 315-340
(55) J Nucl Med 2003; Chesnay E, et al. Early response to chemotherapy in hypopharyngeal cancer: assessment with 11C-methionine PET, correlation with morphologic response, and clinical outcome. 44: 526-532
(56) J Nucl Med 2003; Hustinx R, et al. Whole-body tumor imaging using PET and 2-18F-fluoro-L-tyrosine: preliminary evaluation and comparison with FDG. 44: 533-539
(57) J Nucl Med 2003; Oyama N, et al. 11C-acetate PET imaging of prostate cancer: detection of recurrent disease at PSA relapse. 44: 549-555
(58) J Nucl Med 2003; Dimitrakopoulou-Strauss A, Strauss L. PET imaging of prostate cancer with 11C-acetate. 44: 556-558 (No abstract available)
(59) J Nucl Med 2003; Torizuka T, et al. Imaging gynecologic tumors: comparison of 11C-choline PET with 18F-FDG PET. 44: 1051-1056
(60) AJR 2003; Kalra MK, et al. Correlation of positron emission tomography and CT in evaluating pancreatic tumors: technical and clinical implications. 181: 387-393 (No abstract available)
(61) J Nucl Med 2003; Vranjesevic D, et al. Relationship between 18F-FDG uptake and breast density in women with normal breast tissue. 44: 1238-1242
(62) J Nucl Med 2003; Cohade C, et al. "USA-fat": prevalence is related to ambient outdoor temperature- evaluation with 18F-FDG PET/CT. 44: 1267-1270
(63) J Nucl Med 2003; Buck AK, et al. Imaging proliferation in lung tumors with PET: 18F-FLT versus 18F-FDG. 44: 1426-1431
(64) J Nucl Med 2003; Shields AF. PET imaging with 18F-FLT and thymidine analogs: promise and pitfalls. 44: 1432-1434 (No abstract available)
(65) J Nucl Med 2003; Vesselle H, et al. 18F-fluorothymidine radiation dosimetry in human PET imaging studies. 44: 1482-1488
(66) AJR 2003; Fayad LM, et al. Sacral fractures: a potential pitfall of FDG positron emission tomography. 181: 1239-1243
(67) J Nucl Med 2003; Yeung HW, et al. Patterns of 18F-FDG uptake in adipose tissue and muscle: a potential source of false-positives for PET. 44: 1789-1796
(68) Radiology 2003; Tatsumi M, et al. Fluorodeoxyglucose uptake in the aortic wall at PET/CT: possible finding for active atherosclerosis. 229: 831-837
(69) J Nucl Med 2003; Cobben DCP, et al. 3'-18F-fluoro-3'-deoxy-L-thymidine: a new tracer for staging metastatic melanoma? 44: 1927-1932
(70) J Nucl Med 2003; Schwartz JL, et al. Monitoring tumor cell proliferation by targeting DNA synthetic processes with thymidine and thymidine analogs. 44: 2027-2032
(71) AJR 2004; Nguyen M, et al. CT with histopathologic correlation of FDG uptake in a patient with pulmonary granuloma and pleural plaque caused by remote talc pleurodesis. 182: 92-94 (No abstract available)
(72) AJR 1997; Murray JG, et al. Talc pleurodesis simulating pleural metastases on 18F-fluorodeoxyglucose positron emission tomography. 168: 359-360 (No abstract available)
(73) AJR 2004; Yoshida Y, et al. Incremental benefit of FDG positron emission tomography over CT alone for the preoperative staging of ovarian cancer. 182: 227- 233
(74) J Nucl Med 2004; Kostakoglu L, Goldsmith SJ. PET in the assessment of therapy response in patients with carcinoma of the head and neck and of the esophagus. 45: 56-68
(75) Radiology 2004; Agress H, Cooper BZ. Detection of clinically unexpected malignant and premalignant tumors with whole-body FDG PET: histopathologic comparison. 230: 417-422
(76) J Nucl Med 2004; Bradley JD, et al. Implementing biologic target volumes in radiation treatment planning for non-small cell lung cancer. 45 (Suppl): 96S-101S
(77) J Nucl Med 2004; Lerman H, et al. Normal and abnormal 18F-FDG endometrial and ovarian uptake in pre- and postmenopausal patients: assessment by PET/CT. 45: 266-271
(78) J Nucl Med 2004; Even-Sapir E, et al. Assessment of malignant skeletal disease: initial experience with 18F-Fluoride PET/CT and comparison between 18F-Fluoride PET and 18F-Fluoride PET/CT. 45: 272-278
(79) Ann Pharmacother 2002; Mayer D, Bednarczyk EM. Interaction of colony stimulating factors and fluorodeoxyglucose F18 positron emission tomography. 36: 1796-99
(80) AJR 2004; Aberg C, et al. FDG positron emission tomography of bone involvement in sarcoidosis. 182: 975-977 (No abstract available)
(81) AJR 2004; Asad S, et al. False-positive FDG positron emission tomography uptake in nonmalignant chest abnormalities. 182: 983-989 (No abstract available)
(82)
(83) J Nucl Med 2004; Schoder H, et al. Clinical implications of different image reconstruction parameters for interpretation of whole-body PET studies in cancer patients. 45: 559-566
(84) J Nucl Med 2004; van Waarde A, et al. Selectivity of 18F-FLT and 18F-FDG for differentiating tumor from inflammation in a rodent model. 45. 695-700
(85) Radiology 2004; Rohren EM, et al. Clinical applications of PET in oncology. 231: 305-332
(86) J Nucl Med 2004; Tatsumi M, et al. Intense 18F-FDG uptake in brown fat can be reduced pharmacologically. 45: 1189-1193
(87) J Nucl Med 2004; Becherer A, et al. Imaging of advanced neuroendocrine tumors with 18F-fluoro-DOPA PET. 45: 1161-1167
(88) J Nucl Med 2004; Seltzer MA, et al. Radiation dose estimates in humans for 11C-acetate whole-body PET. 45: 1233-1236
(89) J Nucl Med 2004; Ogawa M, et al. 18F-FDG accumulation in atherosclerotic plaques: immunohistochemical and PET imaging study. 45: 1245-1250
(90) J Nucl Med 2004; Bagheri B, et al. Characterization of the normal adrenal gland with 18F-FDG PET/CT: 45: 1340-1343
(91) AJR 2004; Truong MT, et al. Focal FDG uptake in mediastinal brown fat mimicking malignancy: a potential pitfall resolved on PET/CT. 183: 1127-1132
(92) AJR 2004; Kavanagh PV, et al. Nonneoplastic diseases in the chest showing increased activity on FDG PET. 183: 1133-1141 (No abstract available)
(93) AJR 2004; Pandit-Taskar N, et al. Clinical significance of unexplained abnormal focal FDG uptake in the abdomen during whole-body PET. 183: 1143-1147
(94) J Nucl Med 2004; Cobben DC, et al. Is 18F-3'-fluoro-3'-deoxy-L-thymidine useful for staging and restaging non-small cell lung cancer? 45: 1677-1682
(95) Nucl Med 2004; Kumar R, et al. 18F-FDG PET for evaluation of the treatment response in patients with gastrointestinal tract lymphomas. 45: 1796-1803
(96) J Nucl Med 2004; Kamel EM, et al. Significance of incidental 18F-FDG accumulations in the gastrointestinal tract in PET/CT: correlation with endoscopic and histopathologic results. 45: 1804-1810
(97) J Nucl Med 2004; Ben-Haim S, et al. Evaluation of 18F-FDG uptake and arterial wall calcifications using 18F-FDG PET/CT. 45: 1816-1821
(98) Radiographics 2004; Ferdinand B, et al. Spectrum of thymic uptake at 18F-FDG PET. 24: 1611-1616
(99) J Nucl Med 2005; Salaun PY, et al. An analysis of the 18F-FDG uptake pattern in the stomach. 46: 48-51
(100) J Nucl Med 2005; Waldherr C, et al. Monitoring antiproliferative responses to kinase inhibitor therapy in mice with 3'-deoxy-3'-18F-fluorothymidine PET. 46: 114-120
(101) AJR 2005; Fan CM, et al. Lipomatous hypertrophy of the interatrial septum: increased uptake on FDG PET. 184: 339-342
(102) J Nucl Med 2005; Muzi M, et al. Kinetic analysis of 3'-deoxy-3'-fluorothymidine PET studies: validation studies in patients with lung cancer. 46: 274-282
(103) Radiology 2005; Nakamoto Y, et al. Normal FDG distribution patterns in the head and neck: PET/CT evaluation. 234: 879-885
(104) Radiographics 2005; Kazama T, et al. FDG PET in the evaluation of treatment for lymphoma: clinical usefulness and pitfalls. 25: 191-207
(105) J Nucl Med 2005; van Westreenen HL, et al. Comparison of 18F-FLT PET and 18F-FDG PET in esophageal cancer. 46: 400-406
(106) J Nucl Med 2005; PET with O-(2-18F-Fluoroethyl)-L-tyrosine in peripheral tumors: first clinical results. 46: 411-416
(107) J Nucl Med 2005; Jaskowiak CJ, et al. Influence of reconstruction iterations on 18F-FDG PET/CT standardized uptake values. 46: 424-428
(108) AJR 2005; Aide N, et al. Persistent foreign body reaction around inguinal mesh prostheses: a potential pitfall of FDG PET. 184: 1172-1177
(109) Radiol Clin N Am 2004; Alavi A, et al. PET: a revolution in medical imaging. 42: 983-1001
(110) Radiol Clin N Am 2004; Acton PD, et al. Quantification in PET. 42: 1055-1062
(111) Radiol Clin N Am 2004; El-Haddad G, et al. Normal variants in [18F]-fluorodeoxyglucose PET imaging. 42: 1063-1081
(112) Radiol Clin N Am 2004; Zhuang H, et al. Investigation of thyroid, head, and neck cancers with PET. 42: 1101-1111
(113) J Nucl Med 2005; Ishimori T, et al. Detection of unexpected additional primary malignancies with PET/CT. 46: 752-757
(114) J Nucl Med 2005; Israel O, et al. PET/CT detection of unexpected gastrointestinal foci of 18F-FDG uptake: incidence, loclaization, patterns, and clinical signifincace. 46: 758-762
(115) J Nucl Med 2005; Kobayashi Y, et al. Aortic wall inflammation due to Takayasu arteritis imaged with 18F-FDG PET coregistered with enhanced CT. 46: 917-922
(116) J Nucl Med 2005; Yun M, et al. The role of gastric distention in differentiating recurrent tumor from physiologic uptake in the remnant stomach on 18F-FDG PET: 46: 953-957
(117) J Nucl Med 2005; Chen W, et al. Imaging proliferation in brain tumors with 18F-FLT PET: comparison with 18F-FDG. 46: 945-952
(118) J Nucl Med 2005; Weber WA. Use of PET for monitoring cancer therapy and predicting outcome. 46: 983-995
(119) J Nucl Cardiol 2005; Tawakol A, et al. Noninvasive in vivo measurement of vascular inflammation with F-18 fluorodeoxyglucose positron emission tomography. 12: 294-301
(120) Radiology 2005; Geun J, et al. Focal uptake of fluorodeoxyglucose by the thyroid in patients undergoing initial disease staging with combined PET/CT for non-small cell lung cancer. 236: 271-275
(121) J Nucl Med 2005; Dunphy MPS, et al. Association of vascular 18F-FDG uptake with vascular calcification. 46: 1278-1284
(122) J Nucl Med 2005; Even-Sapir E. Imaging of malignant bone involvement by morphologic, scintigraphic, and hybrid modalities. 46: 1356-1367
(123) AJR 2005; Gutman F, et al. Incidental colonic focal lesions detected by FDG PET/CT. 185: 495-500
(124) AJR 2005; Wandler E, et al. Diffuse FDG shoulder uptake on PET is associated with clinical findings of osteoarthritis. 185: 797-803
(125) Radiol Clin N Am 2005; Jadvar H, et al. PET in pediatric diseases. 43: 135-152
(126) Radiol Clin N Am 2005; Avril NE, Weber WA. Monitoring response to treatment in patients utilizing PET. 43: 189-204
(127) Radiographics 2005; Blodgett TM, et al. Combined PET-CT in the head and neck. Part 1. Physiologic, altered physiologic, and artifactual FDG uptake. 25: 897-912
(128) J Nucl Med 2005; Kumar R, et al. Potential of dual-time-point imaging to improve breast cancer diagnosis with 18F-FDG PET. 46: 1819-1824
(129) J Nucl Med 2005; Pandit-Taskar N. Oncologic imaging in gynecologic malignancies. 46: 1842-1850
(130) J Nucl Med 2005; Jacobs AH, et al. 18F-fluoro-L-thymidine and 11C-methylmethionine as markers of increased transport and proliferation in brain tumors. 46: 1948-1958
(131) AJR 2006; Mawlawi O, et al. Quantifying the effect of IV contrast media on integrated PET/CT: clinical evaluation. 186: 308-319
(132) J Nucl Med 2006; Pauleit D, et al. 18F-FET-PET compared with 18F-FDG-PET and CT in patients with head and neck cancer. 47: 256-261
(133) J Nucl Med 2006; Even-Sapir E, et al. The detection of bone metastases in patients with high-risk prostate cancer: 99mTc-MDP planar bone scintigraphy, single- and multi-field-of-view SPECT, 18F-fluoride PET, and 18F-fluoride PET/CT. 47: 287-297
(134) J Nucl Med 2006; Cher LM, et al. Correlation of hypoxic cell fraction and angiogenesis with glucose metabolic rate in gliomas using 18F-fluoromisonidazole, 18F-FDG PET, and immunohistochemical studies. 47: 410-418
(135) J Nucl Med 2001; Yun M, et al. 18F-FDG PET in characterizing adrenal lesions detected on CT or MRI. 42: 1795-1799
(136) J Nucl Med 2006; Metser U, et al. 18F-FDG PET/CT in the evaluation of adrenal masses. 47: 32-37
(137) Radiology 2006; Blake MA, et al. Adrenal lesions: characterization with fused PET/CT image in patients with proved or suspected malignancy- initial experience. 238: 970-977
(138) Chest 2006; Yap CS, et al. Evaluation of thoracic tumors with 18F-fluorothymidine and 18F-fluorodeoxyglucose-positron emission tomography. 129: 393-401
(139) J Nucl Med 2006; Meisetschlager G, et al. Gluc-Lys ([18F]FP)-TOCA PET in patients with SSTR-positive tumors: biodistribution and diagnostic evaluation compared with [111In]DTPA-octreotide. 47: 566-573
(140) J Nucl Med 2006; Choi JY, et al. Focal thyroid lesions incidentally identified by integrated 18F-FDG PET/CT: clinical significance and improved characterization. 47: 609-615
(141) J Nucl Med 2006; Chen W, et al. 18F-FDOPA PET imaging of brain tumors: comparison study with 18F-FDG PET and evaluation of diagnostic accuracy. 47: 904-911
(142) J Nucl Med 2006; Jacene HA, et al. Effects of pegfilgrastim on normal biodistribution of 18F-FDG: preclinical and clinical studies. 47: 950-956
(143) J Nucl Med 2006; Shankar LK, et al. Consensus recommendations for the use of 18F-FDG PET as an indicator of therapeutic response in patients in national cancer institute trials. 47: 1059-1066
(144) AJR 2006; Korn RL, et al. Unexpected focal hypermetabolic activity in the breast: significance in patients undergoing 18F-FDG PET/CT. 187: 81-85
(145) J Nucl Med 2006; Avril N. 18F-FDG PET after radiofrequency ablation: is timing everything? 47: 1235-1237
(146) J Nucl Med 2006; Rosen RS, et al. Increased 18F-FDG uptake in degenerative disease of the spine: characterization with 18F-FDG-PET/CT. 47: 1274-1280
(147) J Nucl Med 2006; Jhanwar Y, Straus DJ. The role of PET in lymphoma. 47: 1326-1334
(148) J Nucl Med 2006; Montravers F, et al. Can fluorodihydroxyphenylalanine PET replace somoatostatin receptor scintigraphy in patients with digestive endocrine tumors? 47: 1455-1462
(149) AJR 2006; Iagaru A, Henderson R. PET/CT followup in nonossifying fibroma. 187: 830-832
(150) AJR 2006; Goodin GS, et al. PET/CT characterization of fibroosseous defects in children: 18F-FDG uptake can mimic metastatic disease. 187: 1124-1128
(151) J Nucl Med 2006; Agool A, et al. 18F-FLT PET in hematologic disorders: a novel technique to analyze the bone marrow compartment. 47: 1592-1598
(152) J Nucl Med 2006; Muzi M, et al. Kinetic analysis of 3'-deoxy-3'-18F-fluorothymidine in patients with gliomas. 47: 1612-1621
(153) J Nucl Med 2006; Kamel EM, et al. Forced diuresis improved the diagnostic accuracy of 18F-FDG-PET in abdominopelvic malignancies. 47: 1803-1807
(154) J Nucl Med 2006; Cherk MH, et al. Lack of correlation of hypoxic cell fraction and angiogenesis with glucose metabolic rate in non-small cell lung cancer assessed by 18F-fluoromisonidazole and 18F-FDG-PET. 47: 1921-1926
(155) Radiographics 2006; Chong S, et al. Integrated PET-CT for the characterization of adrenal gland lesions in cancer patients: diagnosic efficacy and interpretation pitfalls. 26: 1811-1826
(156) Radiographics 2007; Prabhakar HB, et al. Bowel hot spots at PET-CT. 27: 145-159