Using a machine-learning (ML) model that incorporates prostate MRI data can provide personalized risk estimates of the disease, a team of investigators has found.
Access to prostate MRI remains limited due to resource constraints and the need for expert interpretation -- which is why machine learning could help, wrote a group led by Jesse Persily, MD, of New York University School of Medicine. The findings were published November 4 in the Journal of Magnetic Resonance Imaging.
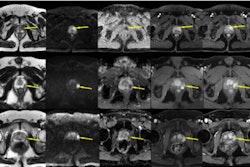
The researchers sought to develop ML models that would allow for risk-based triage for prostate MRI via a study that included data from 11,879 MRI scans for suspected prostate cancer. They set aside 9,504 exams for a model training set and 2,375 for a test set. Field strength and sequence of the exams were 1.5-tesla and 3-tesla/turbo-spin echo T2-weighted imaging (T2WI), diffusion-weighted imaging (DWI), and dynamic contrast-enhanced (DCE). The researchers culled PI-RADS scores from MRI reports and developed two models that would estimate the likelihood of an abnormal MRI (PI-RADS ≥ 3). Model A included the following data: age, prostate-specific antigen (PSA) results, body mass index, and prostate volume; Model B included age, PSA, body mass index, and systolic blood pressure, but not prostate volume.
Overall, the researchers reported that both models outperformed PSA testing alone by area under the receiver operating characteristic curve (AUC):
Model performance compared to PSA testing for estimating the likelihood of abnormal prostate MRI | |||
Measure | PSA alone | Model A (included prostate volume data) | Model B (did not include prostate volume data) |
| AUC | 0.593 | 0.711 | 0.616 |
Model A also outperformed PSA testing (at a threshold of >4 ng/mL) for specificity (28.3% versus 21.9%) and showed comparable performance for sensitivity (89% versus 86.7%).
Finally, the group reported a false negative rate for Model A of 8% and of 16.8% for Model B. However, most of these false negatives were found on biopsy to be either benign or clinically insignificant (Model A, 87% and Model B, 69%).
"[A machine-learning algorithm] provides personalized risk estimates of abnormal prostate MRI and can support triage of this test," the team concluded.
The complete study can be found here.


![Overview of the study design. (A) The fully automated deep learning framework was developed to estimate body composition (BC) (defined as subcutaneous adipose tissue [SAT] in liters; visceral adipose tissue [VAT] in liters; skeletal muscle [SM] in liters; SM fat fraction [SMFF] as a percentage; and intramuscular adipose tissue [IMAT] in deciliters) from MRI. The fully automated framework comprised one model (model 1) to quantify different BC measures (SAT, VAT, SM, SMFF, and IMAT) as three-dimensional (3D) measures from whole-body MRI scans. The second model (model 2) was trained to identify standardized anatomic landmarks along the craniocaudal body axis (z coordinate field), which allowed for subdividing the whole-body measures into different subregions typically examined on clinical routine MRI scans (chest, abdomen, and pelvis). (B) BC was quantified from whole-body MRI in over 66,000 individuals from two large population-based cohort studies, the UK Biobank (UKB) (36,317 individuals) and the German National Cohort (NAKO) (30,291 individuals). Bar graphs show age distribution by sex and cohort. BMI = body mass index. (C) After the performance assessment of the fully automated framework, the change in BC measures, distributions, and profiles across age decades were investigated. Age-, sex-, and height-adjusted body composition reference curves were calculated and made publicly available in a web-based z-score calculator (https://circ-ml.github.io).](https://img.auntminnie.com/mindful/smg/workspaces/default/uploads/2026/05/body-comp.XgAjTfPj1W.jpg?auto=format%2Ccompress&fit=crop&h=100&q=70&w=100)


![Overview of the study design. (A) The fully automated deep learning framework was developed to estimate body composition (BC) (defined as subcutaneous adipose tissue [SAT] in liters; visceral adipose tissue [VAT] in liters; skeletal muscle [SM] in liters; SM fat fraction [SMFF] as a percentage; and intramuscular adipose tissue [IMAT] in deciliters) from MRI. The fully automated framework comprised one model (model 1) to quantify different BC measures (SAT, VAT, SM, SMFF, and IMAT) as three-dimensional (3D) measures from whole-body MRI scans. The second model (model 2) was trained to identify standardized anatomic landmarks along the craniocaudal body axis (z coordinate field), which allowed for subdividing the whole-body measures into different subregions typically examined on clinical routine MRI scans (chest, abdomen, and pelvis). (B) BC was quantified from whole-body MRI in over 66,000 individuals from two large population-based cohort studies, the UK Biobank (UKB) (36,317 individuals) and the German National Cohort (NAKO) (30,291 individuals). Bar graphs show age distribution by sex and cohort. BMI = body mass index. (C) After the performance assessment of the fully automated framework, the change in BC measures, distributions, and profiles across age decades were investigated. Age-, sex-, and height-adjusted body composition reference curves were calculated and made publicly available in a web-based z-score calculator (https://circ-ml.github.io).](https://img.auntminnie.com/mindful/smg/workspaces/default/uploads/2026/05/body-comp.XgAjTfPj1W.jpg?auto=format%2Ccompress&fit=crop&h=112&q=70&w=112)


