Susceptibility-weighted MRI reveals that patients who have recovered from COVID-19 show changes in their brains up to six months later, according to research to be presented at the upcoming RSNA meeting.
The findings shed light on how COVID-19 affects the brain long-term, study co-author and doctoral candidate Sapna Mishra of the Indian Institute of Technology in Delhi said in an RSNA statement.
"Group-level studies have not previously focused on COVID-19 changes in magnetic susceptibility of the brain despite several case reports signaling such abnormalities," she said. "Our study highlights ... new aspects of the neurological effects of COVID-19 and reports significant abnormalities in COVID survivors."
A fifth of adults who contract COVID-19 develop long-term effects, including neurological symptoms such as difficulty concentrating, headache, sleep disruptions, changes in smell or taste, and depression or anxiety, the group wrote. Mishra's group used data from MRI susceptibility-weighted exams to investigate whether people recovered from COVID-19 experienced any of these long-term effects. The study included 46 individuals who recovered from the illness and 30 healthy controls. The 46 participants in the COVID cohort underwent an MRI exam within six months of recovery.
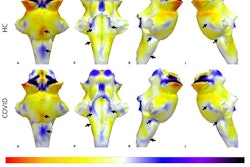
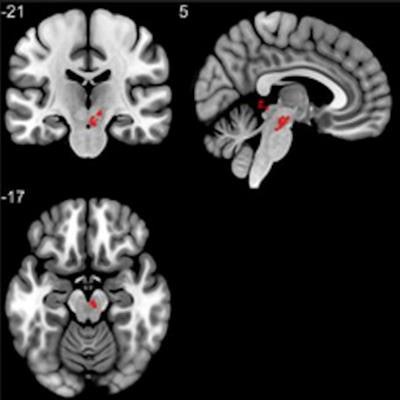
 Group analysis on susceptibility-weighted imaging exhibiting higher susceptibility-weighted imaging values in the COVID group when compared to healthy controls. Three significant clusters were found primarily in the white matter regions of the prefrontal cortex and in the brainstem. The clusters (A) and (B) are observed bilaterally in the cerebral white matter near the orbitofrontal gyrus, whereas (C) lies in the midbrain region. Image and caption courtesy of the RSNA and Sapna Mishra.
Different compounds in the body such as blood, iron, and calcium, carry different "magnetic susceptibility" on MRI, Mishra noted, and tracking these differences can help detect and monitor conditions such as microbleeds, vascular abnormalities, brain tumors, and stroke, the researchers explained.
"Changes in susceptibility values of brain regions may be indicative of local compositional changes," she said.
The study showed that participants who had COVID-19 and recovered had higher susceptibility values on MRI in their frontal lobes and brain stems compared to the healthy controls -- brain regions linked to fatigue, insomnia, depression, headaches, and cognitive disruptions, according to Mishra's group. The researchers also found differences in the right ventral diencephalon area of the brain stem, which coordinates the endocrine system and regulates the sleep-wake cycle, among other tasks.
"This study points to serious long-term complications that may be caused by the coronavirus, even months after recovery from the infection," Mishra said in the RSNA statement.