
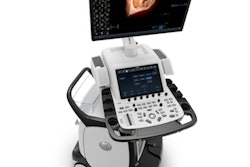
GE Healthcare is launching a new 7-tesla MRI scanner at the virtual International Society for Magnetic Resonance in Medicine (ISMRM) meeting.
Signa 7.0T was designed to address limitations of current MRI systems by using ultrahigh-field magnet technology that offers five times more power than most devices, according to the firm. The system is pending clearance from the U.S. Food and Drug Administration.
The scanner features a 60-cm bore, which is particularly effective for neurodegenerative disease imaging and extremities, as well as the company's UltraG gradient technology. It also includes GE's SignaWorks applications platform with AIRx for automated slice positioning and GE's Silent Scan imaging technology.
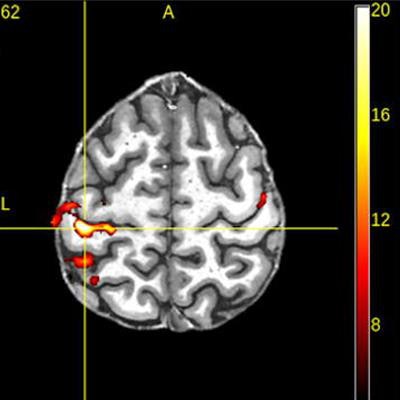
Sample images acquired on Signa 7.0T scanner. Images courtesy of GE Healthcare.In addition to Signa 7.0T, GE is highlighting two investigational devices at ISMRM 2020: Signa UHP (ultra-high performance), a 3-tesla MRI scanner, and new head-only gradients called Microstructure Anatomy Gradient for Neuroimaging with Ultrafast Scanning (Magnus).
Signa UHP 3T includes many of Signa 7.0T's features but at a lower field strength. This will make the scanner accessible to research sites across a variety of budgets, according to the firm.
The Magnus gradients are being used in a head-only device for a study conducted by GE's Research Center and Uniformed Services University (USU) and funded by the U.S. Department of Defense. The study will test military personnel with acute and chronic mild traumatic brain injury.
The Magnus gradients perform in the 500 to 700 tesla/meter/second (T/m/s) and 200 to 300 millitesla/meter (mT/m) range compared with ranges of 200 T/m/s and 50 to 80 mT/m found in conventional scanners, GE said.


![Overview of the study design. (A) The fully automated deep learning framework was developed to estimate body composition (BC) (defined as subcutaneous adipose tissue [SAT] in liters; visceral adipose tissue [VAT] in liters; skeletal muscle [SM] in liters; SM fat fraction [SMFF] as a percentage; and intramuscular adipose tissue [IMAT] in deciliters) from MRI. The fully automated framework comprised one model (model 1) to quantify different BC measures (SAT, VAT, SM, SMFF, and IMAT) as three-dimensional (3D) measures from whole-body MRI scans. The second model (model 2) was trained to identify standardized anatomic landmarks along the craniocaudal body axis (z coordinate field), which allowed for subdividing the whole-body measures into different subregions typically examined on clinical routine MRI scans (chest, abdomen, and pelvis). (B) BC was quantified from whole-body MRI in over 66,000 individuals from two large population-based cohort studies, the UK Biobank (UKB) (36,317 individuals) and the German National Cohort (NAKO) (30,291 individuals). Bar graphs show age distribution by sex and cohort. BMI = body mass index. (C) After the performance assessment of the fully automated framework, the change in BC measures, distributions, and profiles across age decades were investigated. Age-, sex-, and height-adjusted body composition reference curves were calculated and made publicly available in a web-based z-score calculator (https://circ-ml.github.io).](https://img.auntminnie.com/mindful/smg/workspaces/default/uploads/2026/05/body-comp.XgAjTfPj1W.jpg?auto=format%2Ccompress&fit=crop&h=100&q=70&w=100)


![Overview of the study design. (A) The fully automated deep learning framework was developed to estimate body composition (BC) (defined as subcutaneous adipose tissue [SAT] in liters; visceral adipose tissue [VAT] in liters; skeletal muscle [SM] in liters; SM fat fraction [SMFF] as a percentage; and intramuscular adipose tissue [IMAT] in deciliters) from MRI. The fully automated framework comprised one model (model 1) to quantify different BC measures (SAT, VAT, SM, SMFF, and IMAT) as three-dimensional (3D) measures from whole-body MRI scans. The second model (model 2) was trained to identify standardized anatomic landmarks along the craniocaudal body axis (z coordinate field), which allowed for subdividing the whole-body measures into different subregions typically examined on clinical routine MRI scans (chest, abdomen, and pelvis). (B) BC was quantified from whole-body MRI in over 66,000 individuals from two large population-based cohort studies, the UK Biobank (UKB) (36,317 individuals) and the German National Cohort (NAKO) (30,291 individuals). Bar graphs show age distribution by sex and cohort. BMI = body mass index. (C) After the performance assessment of the fully automated framework, the change in BC measures, distributions, and profiles across age decades were investigated. Age-, sex-, and height-adjusted body composition reference curves were calculated and made publicly available in a web-based z-score calculator (https://circ-ml.github.io).](https://img.auntminnie.com/mindful/smg/workspaces/default/uploads/2026/05/body-comp.XgAjTfPj1W.jpg?auto=format%2Ccompress&fit=crop&h=112&q=70&w=112)


