The addition of gadolinium contrast to MRI scans can bolster diagnoses and help predict the recurrence of a common form of shoulder pain and stiffness among adults 50 and older, according to a study presented at the American College of Rheumatology (ACR) annual meeting in Atlanta.
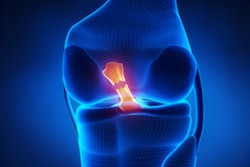
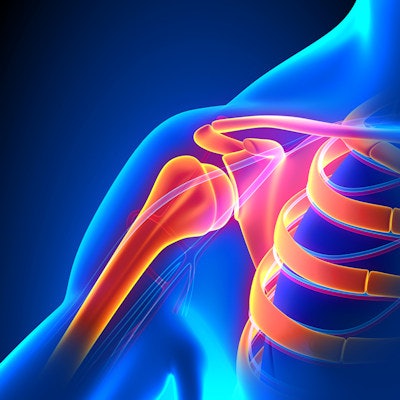
Gadolinium-enhanced MR images allowed clinicians to better visualize the downside of polymyalgia rheumatica, which causes inflamed ligaments, rotator cuff tendinitis, and other musculoskeletal ailments, as well as inflammatory effects that make the condition hard to assess.
"The diagnosis of polymyalgia rheumatica remains challenging," noted lead author Dr. Kazuro Kamada, a rheumatologist at Tomakomai City Hospital in Japan, in an ACR statement. "So, we need a new diagnostic tool with high specificity and sensitivity for polymyalgia rheumatica."
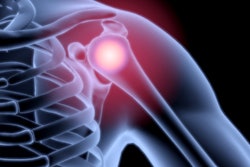
Polymyalgia rheumatica causes widespread aching and stiffness in the upper arms, neck, lower back, and thighs, especially among older Caucasians, and sometimes accompanies giant cell arteritis, a disease that occurs in the blood vessels, according to the ACR. The condition is also difficult to recognize because polymyalgia rheumatica does not often cause swollen joints and can be masked in other rheumatic diseases.
While ultrasound has served to identify polymyalgia rheumatica in shoulder joints, MRI can visualize bone and muscle lesions. How well the modality might perform with contrast for polymyalgia rheumatica has not yet been explored. So Kamada and colleagues set out "to assess whether gadolinium-enhanced MRI could improve diagnostic accuracy and prognosis prediction in patients with polymyalgia rheumatica," they wrote in their abstract.
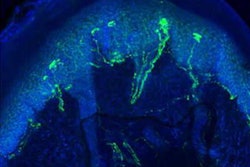
The researchers consecutively enrolled 137 patients with bilateral shoulder pain who were suspected of having polymyalgia rheumatica between June 2012 and June 2018. After the subjects underwent both gadolinium-enhanced MRI and ultrasound shoulder scans, 58 patients (42%) were diagnosed with polymyalgia rheumatica. Gadolinium-enhanced MR images most frequently identified enhancement of joint capsules or rotator cuff tendons and focal bone edema in humerus heads in the affected patients and outperformed ultrasound for sensitivity and specificity.
| Modalities' rates for identifying polymyalgia rheumatica | ||
| Ultrasound | Gadolinium MRI | |
| Sensitivity | 50% | 76% |
| Specificity | 72% | 85% |
To treat the condition, patients initially were given 20 mg of prednisolone on a daily basis, with dose gradually declining as polymyalgia rheumatica headed toward remission. The patients were followed until June 2019 to detect any recurrences.
At follow-up, Kamada and colleagues observed polymyalgia rheumatica recurrence in 24 patients (44%), who primarily were younger and showed less enhancement of the rotator cuff tendon and more synovial hypertrophy.
"Rheumatologists will diagnose polymyalgia rheumatica with confidence using gadolinium-enhanced MRI with high sensitivity and specificity, which will lead to decreasing misdiagnosis of polymyalgia rheumatica," Kamada said. "Moreover, rheumatologists can consider using disease-modifying antirheumatic drugs from the early stage for polymyalgia rheumatica patients if recurrences can be predicted by gadolinium-enhanced MRI.
The researchers plan to validate these findings in a larger cohort to standardize the gadolinium-enhanced MRI procedure for polymyalgia rheumatica.