Arterial spin labeling (ASL) MRI could become a viable complement to digital subtraction angiography (DSA) in screening for hypervascular meningiomas and determining the need for presurgical intervention, according to a study published in the November issue of the American Journal of Roentgenology.
If ASL-MRI can detect increased tumor blood flow in meningiomas that have heightened tumor vascularity on DSA -- also known as tumor blush -- clinicians will have a much better handle on which patients might benefit from preoperative embolization.
"This means that for patient care, meningiomas that do not have high normalized tumor blood flow on ASL-MRI may not need further evaluation or imaging with DSA (if preoperative embolization is a consideration) because they are less likely to show tumor blush on catheter-based angiography, and vice versa" wrote lead author Dr. Vera Mayercik and colleagues from Stanford University Medical Center (AJR, November 2019, Vol. 213:5, pp.1124-1128).
While meningiomas are often asymptomatic, their presence in the brain can cause a disability or mortality if the tumor grows, especially in older adults. One option to assess the abnormality is digital subtraction angiography, which is considered safer and less invasive than surgery. But complications during DSA procedures can include issues related to sedation or anesthesia, result in blood loss, or lead to an ischemic stroke.
On the other hand, ASL-MRI measures irregularities in cerebral blood flow to noninvasively evaluate a variety of anomalies, such as brain tumors and venous thrombosis. With meningioma patients, the presence or absence of tumor enhancement due to contrast fluctuates with signal intensity and could help determine disease malignancy.
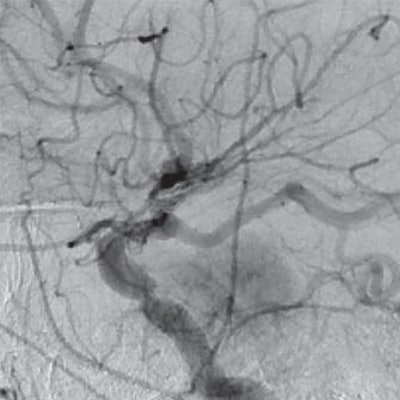
 Images are from a 70-year-old woman with left cavernous sinus meningioma. Gadolinium-enhanced T1-weighted MR image shows left cavernous sinus meningioma (left), while arterial spin-labeling MR image (center) reveals increased signal intensity. Digital subtraction angiography (right) shows positive tumor enhancement with feeding vessel arising from middle meningeal artery. Images courtesy of AJR.
"We hypothesized that increased ASL signal intensity within meningiomas will correlate with the presence of tumor blush on DSA, suggesting that this imaging modality can reliably identify meningiomas that are hypervascular," the authors wrote.
To that end, Mayercik and colleagues retrospectively reviewed 39 meningiomas in 34 patients (mean age, 62.8 ± 14.5 years; range, 32-90 years) who underwent MRI and DSA between January 2008 and January 2017. MRI scans were performed on either a 1.5-tesla scanner (Signa, GE Healthcare) or 3-tesla system (Discovery MR750 and MR750w, GE); all DSA exams were performed on a biplane angiography system (Artis zee, Siemens Healthineers).
Based on ASL images, two independent readers detected all 39 meningiomas, which had a mean size of 9.8 (± 12.2) cm2. Meningiomas with tumor blush had a mean size of 13.4 (± 2.4) cm2, compared with a mean size of 2.7 (± 2.4) cm2 for meningiomas with no tumor blush. Using DSA, the readers also were able to discern 26 lesions (67%) with tumor blush and 13 lesions (33%) with no tumor blush.
As one might expect, mean normalized tumor blood flow was significantly higher in the tumor blush group (4.7 ±1.1), compared with the lesions with no tumor blush (1.5 ±1.1) (p < 0.001). When the researchers used the benchmark of 2.7 for normalized tumor blood flow, they achieved sensitivity of 88% and specificity of 67%. However, they declined to endorse the cutoff of 2.7 as "a single threshold for routine use," because of the study's small sample size.
"Nonetheless, we have shown that meningiomas that have tumor blush on DSA have significantly higher normalized tumor blood flow than those without tumor blush," Mayercik and colleagues concluded. "Thus, ASL-MRI has potential to be used as a screening tool for the selection of candidates who may benefit from preoperative embolization."