How clinically effective is MRI-guided biopsy for prostate cancer? The modality can greatly outperform transrectal ultrasound (TRUS)-guided biopsy results in detecting positive cases, concluded a new study published in the August issue of the American Journal of Roentgenology.
In addition, more than 70% of patients received a new or upgraded diagnosis of prostate cancer, while more than 60% of patients went on to treatment. Perhaps most importantly, MRI-guided biopsies detected positive cases of prostate cancer in two-thirds of patients whose results were negative on one or more TRUS-guided procedures (AJR, August 2019, Vol. 213:2, pp. 371-376).
"These findings provide reassurance that the use of this complex and expensive technology frequently leads to significant and management-changing biopsy results in actual clinical practice," wrote Dr. Nicholas Meermeier and colleagues from the Oregon Health & Science University in Portland.
From the approximately 1 million prostate biopsies performed in the U.S. each year, clinicians discovered some 165,000 new cases of prostate cancer in 2018. While TRUS-guided biopsy remains the first option for evaluation, multiparametric MRI has gained utilization due to advancing hardware, software, and biopsy technologies, which include both fusion biopsy and direct in-bore approaches.
However, "surprisingly few studies describing the likelihood of progression to therapy" based on the outcome of MRI-guided prostate biopsies exist, the authors noted, "perhaps because it is presumed that a direct MRI-guided biopsy showing clinically significant cancer will lead to treatment. Although this may be a reasonable assumption, it would seem important to validate that direct MRI-guided biopsies with positive findings do truly change management, given that the technique is novel, is performed at only a few centers, and is technically complex."
To help gain that validation, Meermeier and colleagues set out on this retrospective study of 127 patients (mean age, 68 years; range, 63-73 years), which included 98 patients with unknown cancer and 29 patients with a Gleason score of 6 and whose cancer had not yet been treated. All the patients underwent a multiparametric MRI scan on either a 1.5- or 3-tesla system (Ingenia or Achieva, Philips Healthcare) with an endorectal coil.
MRI-guided biopsy results were positive for 93 patients (73%), with prostate cancer of Gleason score of 7 or greater found in 84 patients (90%). Overall, 90 patients (71%) received a new or upgraded diagnosis of prostate cancer, with 57 of those patients (63%) proceeding to prostatectomy, radiation, or androgen deprivation therapy. In addition, MRI-guided biopsies revealed positive findings among 57 (66%) of 86 patients who had negative findings from one or more TRUS-guided biopsies.
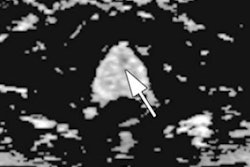
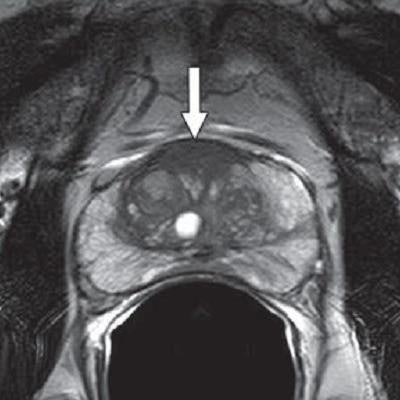
 MR images are from a 65-year-old man with increasing prostate-specific antigen (PSA) level of 6.7 ng/mL and negative findings on TRUS-guided biopsy performed two years earlier. An axial T2-weighted MR image (above) shows nonencapsulated homogeneous triangular 1.9-cm focus (arrow) of reduced T2 signal in midline anterior transition zone. Axial oblique T2-weighted MR image (below) acquired in plane of needle introducer after needle deployment during direct MRI-guided biopsy shows needle (arrows) traversing target. Images courtesy of AJR.
"The present study supports the use of direct MRI-guided biopsy as an appropriate problem-solving diagnostic approach for patients with suspicious findings on MRI and negative findings of prior TRUS-guided systematic biopsy, biopsy-naive patients, or patients with a prior biopsy showing Gleason score 6 disease only," Meermeier and colleagues concluded. "As such, we would suggest that direct MRI-guided biopsy be considered in those scenarios for patients who may otherwise be considered for TRUS-guided systematic biopsy or saturation biopsy."