MRI contrast developer AMAG Pharmaceuticals of Cambridge, MA, has received fast-track status from the U.S. Food and Drug Administration (FDA) for a regulatory application for its ferumoxytol imaging agent.
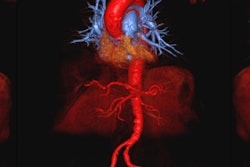
AMAG is developing ferumoxytol for vascular-enhanced MRI to improve the assessment of peripheral arterial disease in patients with known or suspected chronic kidney disease. If approved by the FDA, ferumoxytol could offer an alternative to gadolinium-based contrast agents, which are required to contain a black box warning highlighting the risks of using gadolinium-based agents in patients with advanced kidney disease, according to the company.
The fast-track designation is designed to facilitate the development and expedite the review of products intended to treat serious or life threatening conditions and that demonstrate the potential to address unmet medical needs for those conditions. The designation can reduce the time it takes the FDA to review a new drug application (NDA) from 10 to six months.
AMAG said it plans to start a phase II study for ferumoxytol in the detection of clinically significant arterial stenosis or occlusion in subjects with intermittent claudication (leg pain with walking) in the third quarter of 2008.
Related Reading
Advanced Magnetics changes name to AMAG, July 26, 2007
Advanced Magnetics proposes stock offering, May 17, 2007
Advanced Magnetics names Arkowitz as CFO, April 6, 2007
Goldstein to retire from Advanced Magnetics, April 3, 2007
Advanced Magnetics shuffles execs, November 9, 2006
Copyright © 2008 AuntMinnie.com

![Overview of the study design. (A) The fully automated deep learning framework was developed to estimate body composition (BC) (defined as subcutaneous adipose tissue [SAT] in liters; visceral adipose tissue [VAT] in liters; skeletal muscle [SM] in liters; SM fat fraction [SMFF] as a percentage; and intramuscular adipose tissue [IMAT] in deciliters) from MRI. The fully automated framework comprised one model (model 1) to quantify different BC measures (SAT, VAT, SM, SMFF, and IMAT) as three-dimensional (3D) measures from whole-body MRI scans. The second model (model 2) was trained to identify standardized anatomic landmarks along the craniocaudal body axis (z coordinate field), which allowed for subdividing the whole-body measures into different subregions typically examined on clinical routine MRI scans (chest, abdomen, and pelvis). (B) BC was quantified from whole-body MRI in over 66,000 individuals from two large population-based cohort studies, the UK Biobank (UKB) (36,317 individuals) and the German National Cohort (NAKO) (30,291 individuals). Bar graphs show age distribution by sex and cohort. BMI = body mass index. (C) After the performance assessment of the fully automated framework, the change in BC measures, distributions, and profiles across age decades were investigated. Age-, sex-, and height-adjusted body composition reference curves were calculated and made publicly available in a web-based z-score calculator (https://circ-ml.github.io).](https://img.auntminnie.com/mindful/smg/workspaces/default/uploads/2026/05/body-comp.XgAjTfPj1W.jpg?auto=format%2Ccompress&fit=crop&h=100&q=70&w=100)


![Overview of the study design. (A) The fully automated deep learning framework was developed to estimate body composition (BC) (defined as subcutaneous adipose tissue [SAT] in liters; visceral adipose tissue [VAT] in liters; skeletal muscle [SM] in liters; SM fat fraction [SMFF] as a percentage; and intramuscular adipose tissue [IMAT] in deciliters) from MRI. The fully automated framework comprised one model (model 1) to quantify different BC measures (SAT, VAT, SM, SMFF, and IMAT) as three-dimensional (3D) measures from whole-body MRI scans. The second model (model 2) was trained to identify standardized anatomic landmarks along the craniocaudal body axis (z coordinate field), which allowed for subdividing the whole-body measures into different subregions typically examined on clinical routine MRI scans (chest, abdomen, and pelvis). (B) BC was quantified from whole-body MRI in over 66,000 individuals from two large population-based cohort studies, the UK Biobank (UKB) (36,317 individuals) and the German National Cohort (NAKO) (30,291 individuals). Bar graphs show age distribution by sex and cohort. BMI = body mass index. (C) After the performance assessment of the fully automated framework, the change in BC measures, distributions, and profiles across age decades were investigated. Age-, sex-, and height-adjusted body composition reference curves were calculated and made publicly available in a web-based z-score calculator (https://circ-ml.github.io).](https://img.auntminnie.com/mindful/smg/workspaces/default/uploads/2026/05/body-comp.XgAjTfPj1W.jpg?auto=format%2Ccompress&fit=crop&h=112&q=70&w=112)


