A predictive model combining multiple ultrasonic parameters could discriminate between different liver diseases in a study published March 19 in Radiology.
A team of researchers led by Fangyi Liu, MD, from the Chinese PLA General Hospital in Beijing, found that their multiparametric ultrasound model can predict metabolic dysfunction-associated steatohepatitis (MASH) in patients with metabolic dysfunction-associated fatty liver disease (MAFLD), regardless of hepatitis B virus infection status.
“These findings are important for noninvasive assessment of the MAFLD disease process,” the Liu team wrote.
Previous studies have demonstrated the predictive power of multiparametric ultrasound models that use attenuation imaging and 2D shear-wave elastography (SWE) for assessing liver disease. The results have been promising when compared to liver biopsy. Researchers in this area have focused on methods for noninvasively assessing liver disease.
However, Liu and colleagues pointed out that these studies have mostly taken place at single centers, with multicenter studies lacking. The researchers investigated the ability of multiparametric ultrasound modeling with attenuation imaging and 2D SWE to predict MASH in patients with MAFLD.
“To our knowledge, this is the first prospective multicenter study on noninvasive quantitative evaluation of MAFLD using multiparametric ultrasound,” they highlighted.
The study included 424 participants with a median age of 47 years. This included 332 participants with MASH and 92 without. All participants underwent multiparametric ultrasound with attenuation imaging and 2D SWE, as well as liver biopsy, from 2020 to 2022 conducted in 12 tertiary hospitals in China.
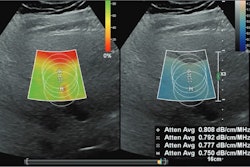
 Multiparametric ultrasound in a 52-year-old female patient with metabolic dysfunction-associated fatty liver disease (MAFLD) and hepatitis B, whose body mass index was 26.9. (A) Gray-scale image (left) shows the liver parenchyma,
and attenuation image (right) shows the right liver lobe acquired from the right intercostal oblique plane, with the degree of attenuation color-coded in the sampling box. Orange indicates a high attenuation coefficient and blue indicates a low attenuation coefficient. The coefficient value (0.59 dB/cm/MHz) and reliability index (R2 = 0.95) are presented in the lower left corner. (B) 2D shear-wave elastography-generated quad-view mode image shows an elasticity map, propagation map, gray-scale image, and dispersion map at the same time. A 1-cm region of interest is placed within the sampling box of each image. Red and blue indicate high and low elasticity and dispersion slope, respectively. Liver stiffness on the elasticity map is 5.6 kPa, and the dispersion slope on the dispersion map is 13.23 (m/sec)/kHz. Image courtesy of the RSNA.
Three parameters were found to have significant associations with MASH: attenuation coefficient (odds ratio [OR], 3.32 [with 1 as reference]; p < 0.001), alanine aminotransferase level (OR, 4.42; p = 0.001), and international normalized ratio (OR, 0.59; p = 0.03).
The researchers developed a combined model with these parameters, with the results being area under the curve (AUC) values of 0.85 and 0.77 for predicting MASH in the training (n = 257) and validation groups (n = 167), respectively.
The team also evaluated the model’s performance on subgroups, including participants with and without diabetes and those with and without hepatitis B. It reported the following respective AUC values: 0.83 (with diabetes), 0.81 (without diabetes), 0.82 (with hepatitis B), and 0.79 (without hepatitis B).
The study authors highlighted that with invasive histologic biopsy being the current reference standard for evaluating MAFLD progression, there is “great clinical value” to be had in exploring noninvasive parameters that can be surrogate markers of relevant histologic features.
However, they noted that because of the different criteria for obesity used in Asian and Western countries, large population-based studies involving Western populations with a higher body mass index (BMI) and a prespecified subgroup analysis are needed to validate the model’s generalizability.
In an accompanying editorial, Karen Reuter, MD, from Tufts University in Boston, MA, concurred with the suggested future directions for the model. She also highlighted the importance of diagnosing steatosis in the general population as a beginning part of the treatment process for early liver disease.
“Decreasing the incidence of liver cirrhosis and liver cancer, such as hepatocellular carcinoma, globally is an important humanitarian and socioeconomic goal for society,” Reuter wrote.
The study can be found in its entirety here.