Attenuation coefficient (AC) measurements from ultrasound can help better detect hepatic steatosis and address interoperator agreement, suggest findings published April 16 in the American Journal of Roentgenology.
Using ultrasound AC algorithms, a team led by Richard Barr, MD, PhD, from Northeastern Ohio Medical University in Youngstown found that the strongest AC measurements showed the best correlation with MRI proton density fat fraction (MRI-PDFF) when obtained using a region of interest (ROI) depth of 4 cm. These also had the highest accuracy for detecting steatosis when obtained using an ROI depth of 3 cm, ROI size of 4 cm, and confidence map threshold of 40%.
“These results are an important step toward the standardization of AC measurements,” Barr and colleagues wrote. “This standardization will aid the application of AC measurements for liver fat quantification.”
Ultrasound systems from different vendors provide algorithms that assess liver fat content based on AC estimations. However, with no standardization in this area and because of variability in the algorithms’ designs, the researchers noted that published cutoff values cannot be applied widely.
The World Federation for Ultrasound in Medicine and Biology (WFUMB) released guidance describing a protocol for hepatic fat quantification using ultrasound algorithms in 2024. It recommended that AC measurements be performed using ROIs placed at a depth of 2 cm and with a size of 3 cm.
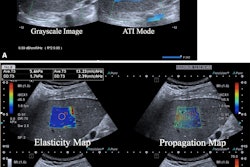
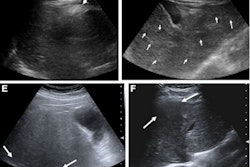
 Ultrasound images depict a 56-year-old man with obesity (body mass index, 42) and steatosis (MRI-PDFF, 10.4%), who underwent ultrasound attenuation coefficient (AC) measurement due to participation in the present study. The unit displays color-coded confidence map (left) and AC map (on right) in side-by-side manner. The confidence map indicates quality of acquired AC signals and is set like traffic lights: green indicates good quality acquisition, yellow indicates warning, and red indicates low quality. Areas with low quality are left blank on the AC map. The image shows multiple circular ROIs placed at depths below the liver capsule of 2, 2.5, 3, and 4 cm. All ROIs are 3.5 cm in size. The confidence map threshold is set at 20%. AC measurements (in units of dB/cm/MHz) were extracted from all ROIs (excluding voxels without assigned color on the AC map) and decrease with greater ROI depth.ARRS
Barr and co-authors highlighted that more evidence is needed on whether these recommendations can be widely applied, citing the “rapidly evolving” field of liver fat quantification using ultrasound AC algorithms. The researchers studied potential links between ROI depth, ROI size, and confidence map threshold with interobserver agreement and diagnostic performance of ultrasound AC measurements. They focused on detecting and grading hepatic steatosis using MRI-PDFF as the reference standard.
Final analysis included prospective data from 101 participants enrolled in 2023 and 2024 with an average age of 54.5 years.
One of two operators acquired AC measurements using a single ultrasound unit. Both operators independently reviewed all videos and placed circular ROIs to obtain AC measurements for all 24 possible combinations of the parameters. These included the following: four ROI depths (2, 2.5, 3, and 4 cm from liver capsule to ROI outer edge), three ROI sizes (3, 3.5, and 4 cm), and two confidence map thresholds (20% and 40%).
For all parameter combinations, interoperator agreement achieved high scores, with intraclass correlation coefficients ranging between 0.92 and 0.98.
AC measurements showed the strongest correlations (Spearman rho, 0.81 and 0.8 for operators 1 and 2, respectively) with MRI-PDFF at an ROI depth of 4 cm. The researchers found that the following parameter combination is best, considering correlations with MRI-PDFF and area under the curve (AUC) across steatosis grades: depth of 4 cm, size of 4 cm, and threshold of 40%.
| AUC values of optimal ultrasound AC parameter combination | ||
|---|---|---|
| Steatosis grade | Operator 1 | Operator 2 |
| > 0 | 0.93 | 0.92 |
| > 1 | 0.88 | 0.86 |
| > 2 | 0.81 | 0.81 |
However, the team reported that the accuracy for detecting steatosis (grade > 0) was highest for the following combination: depth of 3 cm, size of 4 cm, and threshold of 40% (operator 1, 90.1%; operator 2, 82.2%).
The study authors highlighted that these findings could help inform development of a standardized protocol for ultrasound AC measurements. This, in turn, can make way for wider applications for liver fat quantification in clinical care, they added.
“Nevertheless, additional research in larger sample sizes and using AC algorithms from different vendors remains required to gain a more complete understanding of the influence of measurement parameters, including ROI depth and size as well as vendor-specific quality thresholds, on AC performance,” the authors wrote.
The full study can be found here.