Which modality is better for breast cancer diagnosis, contrast-enhanced mammography or dynamic contrast-enhanced breast MRI? It depends on a variety of factors, according to a review published in the July issue of Radiologic Clinics.
Ritse Mann, MD, PhD, of Radboud University Medical Center, Nijmegen, the Netherlands, and colleague Valentina Longo, MD, of Fondazione Policlinico Universitario in Rome, Italy, noted that, although CEM's performance is slightly less than MRI for diagnostic imaging of breast cancer, in "many situations [it is] a viable alternative."
Mammography is the traditional modality for both screening for breast cancer and follow-up of suspicious results, but it has its limits, notably less ability to identify cancer in dense breast tissue. Ultrasound offers another screening tool and can overcome some of mammography's limitations. But contrast-enhanced imaging shows promise for breast cancer diagnosis in that it provides functional information regarding tumor vascularity that "strongly boosts the cancer detection rate in screening and also improve staging," the team explained.
Dynamic contrast-enhanced breast MRI has been available since 1984, while CEM was introduced in 2011. (CEM has been cleared by the U.S. Food and Drug Administration (FDA) as an adjunct modality for breast cancer diagnostic follow-up, but not for screening).
"CEM is mainly suggested as an alternative to MR imaging when MR imaging is not feasible for a patient," Mann and Longo explained.
The two listed some of the benefits and limitations of each of these contrast-enhanced techniques and offered guidance regarding which one to choose in a given clinical situation:
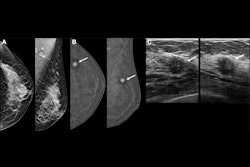
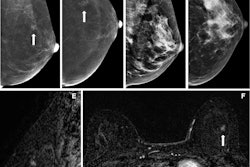
- When compared with standard mammography for diagnosing breast cancer, CEM has shown improved sensitivity (90.5% vs. 52.4%) but also reduced specificity (76.1% vs. 90.5%). Previous research has estimated breast MRI's sensitivity to be up to 100% and its specificity up to 98%.
- MR imaging excels at visualizing areas not well seen on mammography, such as far posterior locations or the axilla. But it's also more expensive and not always covered by insurance.
- Screening with breast MRI is "recommended for very high-risk patients, such as BRCA mutation carriers, as they begin screening at a young age and may be more susceptible to the negative effects of ionizing radiation," the authors wrote.
- One of CEM's main limitations compared to breast MRI is its lower ability to visualize the axillary regions of the breast.
- Breast MRI is effective for imaging patients with implants, as it can assess the integrity of the implants.
- Breast MR imaging is considered standard practice for assessing chemotherapy response.
- Breast MRI does not impart radiation.
The bottom line? Selecting an imaging modality for breast cancer workup takes some careful consideration.
"Factors to take into account when choosing between modalities include the likelihood of strong background parenchymal enhancement (that can be better managed with MR imaging, the importance of radiation (particularly relevant in young women), the availability of the equipment, and women's preferences (due to claustrophobia, compression, noise, and so forth)," Mann and Longo concluded.
The complete study can be found here.