Breast MRI with an ultrafast dynamic contrast-enhanced (DCE) protocol can help predict complete pathologic response to breast cancer treatment, a French study published July 26 in Radiology found.
Researchers led by Dr. Toulsie Ramtohul from the Paris Sciences et Lettres Research University found that by measuring the slope between the time of contrast inflow onset and the time of peak intensity in breast tumors -- known as the wash-in slope -- clinicians can predict how tumors respond to neoadjuvant therapy with high sensitivity.
"Our results indicate that the wash-in slope ... was an independent predictive factor of pathologic complete response and low residual cancer burden after neoadjuvant chemotherapy," Ramtohul et al wrote.
Neoadjuvant chemotherapy is a first-line therapeutic option for early-stage human epidermal growth factor receptor 2 (HER2)-positive and triple-negative breast cancers. This option is tied to higher breast-conserving rates and less need for extensive axillary lymph node dissection.
Pathologic response is used to guide adjuvant decisions for patients with residual disease after preoperative chemotherapy. This makes predicting such a response needed for practices, so predictive factors are being explored.
Breast MRI has been touted as reliable for detecting malignancies in a supplementary role. More specifically, ultrafast DCE-MRI for breast imaging has been explored for faster imaging results with comparable quality to conventional MRI, with parameters showing strong ties with breast cancer prognosis characteristics.
Previous research shows that one such parameter, the wash-in slope, is a predictor of aggressiveness in several cancers. Such slope depends on the peak height and time to peak for contrast agents, which reflect the perfusion flow rate and blood volume in tumors. However, these parameters have not been used to explore neoadjuvant chemotherapy in breast cancer treatment.
Ramtohul and colleagues wanted to find out whether perfusion parameters acquired at initial ultrafast DCE-MRI were linked to early prediction of pathologic complete response after chemotherapy in women with breast cancer.
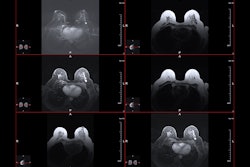
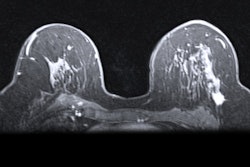
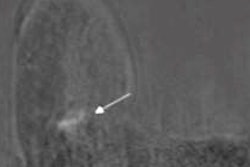
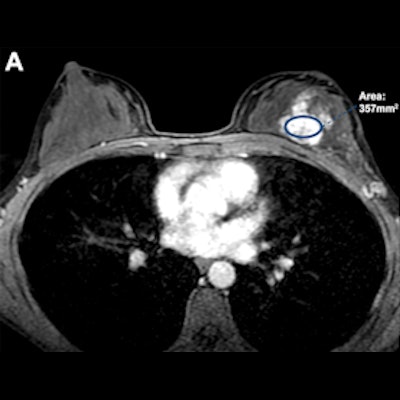
 Ultrafast breast DCE-MRI scans in a 47-year-old woman who underwent neoadjuvant chemotherapy for hormone receptor-negative and HER2-positive cancer. (A) Axial last-phase ultrafast T1-enhanced DCE-MRI scan acquired before therapy, with the largest region of interest placed over the lesion (oval); (B) wash-in slope on the initial ultrafast time-signal intensity curve of the breast cancer; and (C) axial postcontrast T1-enhanced standard DCE-MRI scan acquired after therapy. The tumor manifested as a 4-cm nonmass enhancement in the left breast. The time-signal intensity curve at initial ultrafast DCE-MRI shows a high wash-in slope of 2.7% per second. A DCE-MRI scan acquired after therapy showed no residual enhancement, and histopathologic examination revealed no invasive residual cancer. Images courtesy of RSNA.
They looked at prospective data from 50 women with an average age of 49 years. Out of these, 20 achieved pathologic complete response, while 25 had residual cancer burden.
The team found that a wash-in slope cutoff value of 1.6% per second had a sensitivity of 94% (17 of 18 women) and a specificity of 59% (19 of 32 women) for complete pathologic response. Wash-in slope also was also the factor that was most associated with predicting complete pathologic response, as measured by hazard ratio.
| DCE-MRI factors that predict pathologic complete response to neoadjuvant chemotherapy | |
| Odds ratio | |
| Wash-in slope (> 1.6% per second) | 8.4 |
| Tumor-infiltrating lymphocytes | 6.9 |
| HER2 positivity | 6.3 |
The study authors also found that the area under the receiver operating characteristic curve (AUC) of a prediction model using the three factors in the table was 0.92.
However, the wash-in slope factor had stronger ties to some breast cancer subgroups than others. The team noted that a slope of more than 1.6% per second was associated with higher pathologic complete response rates in the HER2-positive subgroup, with an odds ratio of 21.7 (p = 0.02).
This wash-in slope was also linked to low residual cancer burden for luminal HER2-negative and triple-negative breast cancers (odds ratio, 11; p = 0.04).
"Our results could have several implications because recent improvements in anti-HER2 therapy have drastically increased pathologic complete response for HER2-positive breast cancer, but at greater costs and toxicity, and have led to growing interest in de-escalation neoadjuvant therapies," the researchers wrote.
They added that wash-in slope and its relative change during neoadjuvant chemotherapy need to be further explored in larger studies.
Dr. Cindy Lee and Dr. Linda Moy from New York University concurred with the need for further validation studies, but also touted the study as having "early promising data" ultrafast MRI's use in predicting chemotherapy response.
"Will the ultrafast sequence replace conventional delayed kinetic analysis in existing MRI protocols? How will total ultrafast acquisition time affect the prediction of [pathological complete response]? Will wash-in slope trump the other MRI features or integrate as a variable within multiparametric MRI analysis?" they wrote. "These are exciting questions that the breast imaging community is eager to explore."