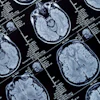
Artifacts on diffusion MRI can be accurately identified by an artificial intelligence (AI) algorithm, according to a presentation at the recent Conference on Machine Intelligence in Medical Imaging (C-MIMI).
Researchers at the University of Pennsylvania have developed 3D-QCNet, a deep-learning model that yielded 94% accuracy in testing for detecting artifacts on diffusion MRI scans.
"Through 3D-QCNet, we demonstrate a method that is shown to be consistently accurate across a wide variety of differing datasets, and is also the first method to be proven to detect artifacts in scans with pathologies," said presenter Adnan Ahmad of the university's Diffusion and Connectomics in Precision Healthcare Research (DiCIPHR) Lab.
Artifacts are a huge problem in diffusion MRI datasets and are almost unavoidable, according to Ahmad. They can affect downstream results, though, and need to be removed, usually manually. This process takes a lot of time, requires expertise, and can be frustrating, he said. It may also be subject to inter-rater variability.
Some automated methods are available, such as QC-Automator (also developed by the University of Pennsylvania), FSL Eddy, and DSI Studio. Unfortunately, these techniques don't detect all types of artifacts and sometimes require fine-tuning of the models, Ahmad said.
"And none of these methods are proven to work on data that contains pathologies," Ahmad said.
To help, the researchers developed an automated 3D deep-learning model that accurately detects artifacts, regardless of data characteristics such as difference in scanners, demographics, or the presence of pathologies, according to Ahmad.
The researchers accomplished this by training, validating, and testing 3D-QCNet using seven different datasets that included a total of 678 subjects and 9,258 volumes. These volumes were all annotated for five different artifacts by one expert reader.
The datasets included the following:
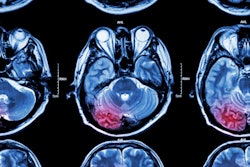
- A traumatic brain injury (TBI) dataset with lesions and white-matter hyperintensities
- A developmental dataset
- An autism dataset
- A TBI dataset with lesions and white-matter hyperintensities
- A dataset including cases with hypertension, cardiovascular disease, and white-matter hyperintensities
- A TBI dataset with lesions and white-matter hyperintensities
- A dataset with only healthy controls
The researchers used datasets 1-3 for training and validation of their DenseNet 3D convolutional neural network, which was trained to classify diffusion MRI volumes as either being normal or containing an artifact. Datasets 4-7 were used for testing, and the images in these datasets were not used during algorithm training and initial validation.
The datasets differed significantly and included a wide range of patient ages, demographics, disease types, and scanner models. In addition, parts of the testing data had characteristics that were not present in the training and validation of the algorithm, according to Ahmad.
"We did this whole process to model a real-life scenario to prove that this would work outside of the lab," he said.
The algorithm performed well across all different types of datasets.
| Accuracy of 3D-QCNet for detecting artifacts on diffusion MRI | |||||
| Dataset 4 (44 subjects, 1,098 volumes including TBI cases with lesions and white-matter hyperintensities) | Dataset 5 (242 subjects, 400 volumes with hypertension, cardiovascular disease, and white-matter hyperintensities) | Dataset 6 (30 subjects, 600 volumes including TBI cases with lesions and white-matter hyperintensities) | Dataset 7 (26 healthy controls, 249 volumes) | Average across all 4 testing datasets | |
| Accuracy | 97% | 92% | 96% | 92% | 94% |
3D-QCNet could be utilized in a variety of scenarios, according to Ahmad.
"It can be implemented as part of a diffusion imaging pipeline just because it has excellent generalizability," he said. "It works regardless of scanner [type], [patient] demographics, or pathological differences."
It could also serve as a convenient "black box" to provide quality control of a practical dataset, he said.