Using MRI, a team of more than 40 investigators has created a profile of the genes, proteins, infiltrating cells, and signaling pathways of the deadly brain cancer glioblastoma. The findings could translate to better patient care, according to the authors of a new study published February 11 in Cancer Cell.
The study illuminates the biology of glioblastoma, wrote a group led by senior author Li Ding, PhD, of Washington University in St. Louis, MO. The research was a collaboration established by the National Cancer Institute of the U.S. National Institutes of Health in Bethesda, MD.
"To improve therapies for this deadly cancer, understanding the tumor cells themselves is important but not enough," Ding said in a statement released by Washington University. "We also must understand the tumor cells' interactions with the surrounding environment, including immune cells and the connective tissues and blood vessels."
Although rare, glioblastoma is the most aggressive of cancers, and it has high mortality rates, with fewer than 10% of patients surviving longer than five years after a diagnosis, Ding's group noted. Unfortunately, research on the genomic features of glioblastoma has not led to more successful treatment.
In the current study, the authors used MRI to create a "map" of glioblastoma that included data from 99 tumors, measuring proteins in the samples as well as protein modifications called phosphorylation and acetylation, which influence how cells communicate.
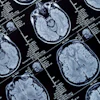
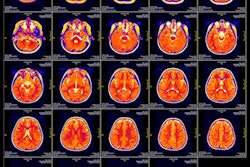
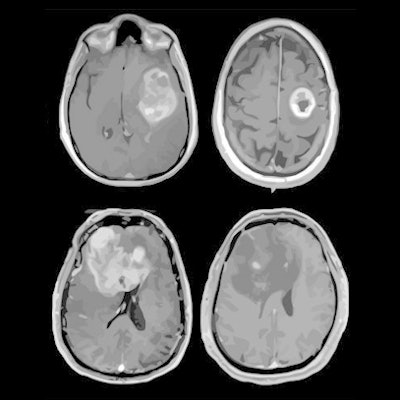
 MRI scans of eight patients with glioblastoma. A new study led by Washington University School of Medicine in St. Louis has detailed molecular and genetic schematics of these tumors, which could improve treatment therapies. Images courtesy of coauthor Dr. Albert Kim, PhD, of Washington University in St. Louis, MO.
The study found the following:
- Two new proteins called PTPN11 and PLCG1 drive tumor growth in some patients.
- Gene expression patterns of a process called "epithelial-to-mesenchymal transition" that is common as tumors form.
- How the protein modification acetylation may explain differences between types of glioblastoma.
The research also suggested that glioblastoma tumors may respond differently to different treatments based on their unique "immune landscape," the investigators noted. They identified four categories of this landscape that are made up of varying combinations of T cells and immune cells called macrophages; therapy that targets macrophages may work well in patients with high numbers of these cells but not as well in patients with lower numbers.
"These patterns provide additional information for researchers to understand how the glioblastoma subtypes they identified may vary in biological function," said co-author Tao Liu, PhD, of Pacific Northwest National Laboratory in Richland, WA, in the statement.
The research could lead to better clinical trial design that could translate into more tailored treatment for patients, according to co-author Dr. Milan Chheda of Washington University.
"For most clinical trials, we take all comers and give them the same treatment," he said in the university statement. "We are not designing trials in the most precise way because we have not fully understood the molecular differences between each patient's tumor. This leads us to call a treatment a failure when in fact it may be helping specific people."