MRI software developer Random Walk Imaging introduced dViewr for analyzing MRI scans at this week's International Society for Magnetic Resonance in Medicine (ISMRM) virtual meeting.
dViewr is the company's first commercially available software application, and it provides parameters that offer detailed tissue microstructure data for clinical researchers and radiologists.
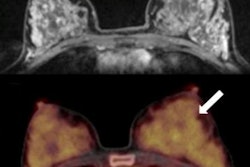
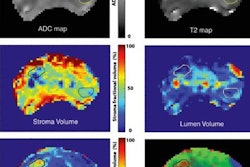
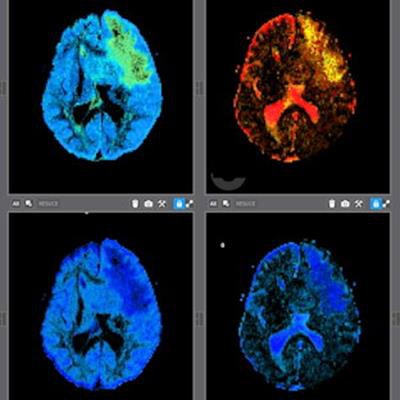
 (Above) Example of novel parameter maps acquired with dVIEWR powered by MICE Toolkit, providing actionable information on tissue microstructure. (Below) Conventional diffusion MRI map, which is not able to resolve the same amount of actionable information from the MRI signal. Photo courtesy of Random Walk.
dViewr is powered by NONPI Medical's Medical Interactive Creative Environment (MICE) Toolkit, which uses a drag-and-drop interface, enabling researchers with little experience to run custom image analyses quickly and easily. Random Walk and NONPI have entered into an exclusive license and development agreement to market dViewr worldwide, according to the companies.