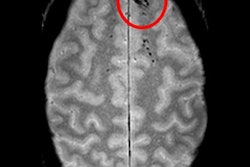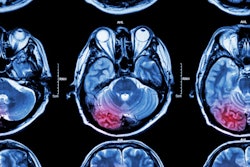
A deep-learning algorithm can accurately detect cerebral microbleeds (CMBs) -- with few false-positive results -- by analyzing brain MR images, according to research published online May 20 in NeuroImage.
Researchers led by Saifeng Liu, PhD, of the MRI Institute for Biomedical Research in Bingham Farms, MI, developed a convolutional neural network-based deep-learning model that yielded 96% sensitivity for finding cerebral microbleeds, with fewer than two false positives per case.
"This study demonstrates the potential of applying deep learning techniques to medical imaging for improving efficiency and accuracy in diagnosis," the authors wrote.
Accurate and reliable detection of cerebral microbleeds is crucial for the diagnosis of Alzheimer's disease, stroke, and traumatic brain injury. However, manual detection by radiologists can be time-consuming and error-prone.
Although they yield promising sensitivity, previously developed automatic detection methods have suffered from frequent false positives. This low precision is partly caused by reliance only on analysis of MRI scans acquired with a 3D susceptibility-weighted imaging (SWI) protocol, according to the researchers. Differentiating blood products from calcifications can be challenging on SWI, and contrast in the SWI data can be dependent on imaging parameters.
"Using phase images, or quantitative susceptibility maps (QSM) reconstructed from phase images, diamagnetic materials such as calcification can be separated from paramagnetic blood products based on the sign of the phase or susceptibility," the authors wrote. "Moreover, because of the much higher susceptibility of the CMBs than the surrounding tissue or veins, phase and QSM may provide valuable features for separating CMBs from their mimics."
As a result, the researchers developed a framework that utilizes data from both SWI and phase images. In the first phase, patients suspected of having cerebral microbleeds are selected using a software algorithm that provides a 3D fast radial symmetry transform of composite SWI images. Deep residual neural networks then remove false-positive findings by analyzing both the SWI and high-pass filtered phase images, according to the authors.
"While the SWI images provide exquisite sensitivity to the presence of blood products, the high-pass filtered phase images enable the differentiation of diamagnetic calcifications from paramagnetic microbleeds," they wrote.
The researchers used 154 preprocessed datasets to train several deep-learning algorithms based on different data and chose the best models after validation on 25 cases. They then evaluated these models on a test set of 41 cases, including 13 hemodialysis cases, nine traumatic brain injury cases, nine stroke cases, and 10 healthy controls. The best-performing model used a combination of SWI and phase images.
| Performance of deep-learning model for detecting cerebral microbleeds | |
| Deep-learning model based on SWI and phase images | |
| Sensitivity | 95.8% |
| Precision | 70.9% |
| False positives per case | 1.6 |
"We demonstrate that with data preprocessing and augmentation, the model provided high sensitivity with a small number of false positives, outperforming both human raters and the single-channel models reported in earlier studies," the authors wrote.
In the future, their method could also be used to study the association between the presence of cerebral microbleeds and the risk of cognitive impairment or intracerebral hemorrhage, according to the researchers.