Tuesday, November 27 | 3:20 p.m.-3:30 p.m. | SSJ06-03 | Room S402AB
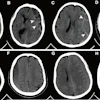
The utilization rate of CT in U.S. hospital emergency departments has sharply increased since 2004, with radiologists continuing to perform most CT interpretations for nearly all subcategories, researchers will report in this Tuesday presentation.Whether a result of advancements in CT technology, inappropriate use, or a combination of unspecified reasons, orders for CT by emergency department clinicians have been on the rise in recent years, noted presenter Dr. Santosh Selvarajan from Jefferson University Hospitals in Philadelphia.
Selvarajan determined the trends in utilization for different subcategories of CT -- including head, body, spine, musculoskeletal, and vascular CT -- based on the Medicare Physician/Supplier Procedure Summary Master Files for 2004-2016. He used Medicare provider specialty codes to deduce which exams were interpreted by radiologists and physicians from other specialties.
Overall, the analysis revealed that CT use in emergency departments increased dramatically in all subcategories. The largest spike was evident in orders for spinal CT, which rose by more than 400%, followed by vascular CT. Neuroimaging, including CT angiography of the head and neck, also increased substantially -- nearly doubling from 2006 to 2016.
Among all physician specialties, radiologists interpreted by far the most scans, reading at least 99% of the CT exams for all subcategories.
These trends in CT usage seem to point toward growth in defensive medicine in U.S. emergency departments, Selvarajan noted. Radiologists may need to work with emergency department physicians to better manage CT utilization rates.