Tuesday, November 28 | 10:50 a.m.-11:00 a.m. | SSG13-03 | Room S404AB
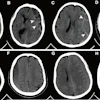
A deep-learning algorithm can swiftly quantify coronary artery calcium scores on low-dose CT lung screening exams, according to researchers from the Netherlands.A coronary artery calcium (CAC) score calculated on low-dose CT lung screening exams is a strong, independent predictor of cardiovascular events, but manual scoring is a cumbersome process. As a result, researchers sought to develop a quick, automatic method for determining cardiovascular risk in these subjects, according to presenter Bob De Vos from University Medical Center Utrecht.
In their approach, a convolutional neural network (CNN) quantifies CAC directly from the images.
"Hence, unlike previous studies that first performed segmentation of CAC lesions and subsequently quantified them, we have determined Agatston scores directly from the images, i.e., without the intermediate segmentation of CAC lesions," De Vos said.
The method also provides users with visual feedback on its decision-making process by displaying a "heat map," which shows the calcified lesions that were relevant for quantification, De Vos said. In addition, it can differentiate CAC from other calcified lesions in the CT scan, such as in the aorta.
"It is not fooled by other types of calcifications, even without specifically spatially guiding the network," he noted.
The CNN can quantify CAC on a full chest CT in less than two seconds, according to De Vos.
"Quick CAC quantification enables high-throughput screening of large sets of CTs for determining the risk of a cardiovascular event," De Vos told AuntMinnie.com. "Furthermore, fast scoring allows [cardiovascular disease] risk stratification as a side finding at low computational cost. This means that the method could be implemented on workstations, instead of [requiring] dedicated high-performance computing servers."
Speed up your own assessment of deep learning by taking in this talk on Tuesday.