Sunday, November 28 | 10:55 a.m.-11:05 a.m. | SSA24-02 | Room E350
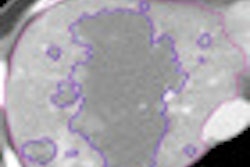
Patients destined to show signs of recurrence after radiofrequency ablation (RFA) of hepatocellular carcinoma (HCC) lesions reveal different CT attenuation patterns within 24 hours of the procedure, according to researchers from Mexico.Adrian Gonzales, MD, and colleagues from the National Institute of Medical Sciences and Nutrition Salvador Zubirán followed 17 ablation procedures in 17 patients with HCC. All patients included in the study underwent CT scans before the procedure and the same day after the procedure, with Hounsfield units measured pre- and post-RFA, and delta calculation of the difference.
At six-month follow-up, local recurrence was evaluated based on imaging criteria for tumor response, with local recurrence defined as an active lesion (characterized by arterial enhancement and washout). Attenuation changes were compared between patients with local recurrence and those who maintained a complete response.
Five patients (30%) with local recurrence at six months had a mean delta of 3.86 HU, compared to 12 patients (70%) with complete response and a change in attenuation of 15.18 HU (p = 0.02). The attenuation differences were significant between those with local recurrence and those without. The results are applicable to patients with early HCC, and results could be used for monitoring during treatment, Gonzales said.


![Images show the pectoralis muscles of a healthy male individual who never smoked (age, 66 years; height, 178 cm; body mass index [BMI, calculated as weight in kilograms divided by height in meters squared], 28.4; number of cigarette pack-years, 0; forced expiratory volume in 1 second [FEV1], 97.6% predicted; FEV1: forced vital capacity [FVC] ratio, 0.71; pectoralis muscle area [PMA], 59.4 cm2; pectoralis muscle volume [PMV], 764 cm3) and a male individual with a smoking history and chronic obstructive pulmonary disorder (COPD) (age, 66 years; height, 178 cm; BMI, 27.5; number of cigarette pack-years, 43.2, FEV1, 48% predicted; FEV1:FVC, 0.56; PMA, 35 cm2; PMV, 480.8 cm3) from the Canadian Cohort Obstructive Lung Disease (i.e., CanCOLD) study. The CT image is shown in the axial plane. The PMV is automatically extracted using the developed deep learning model and overlayed onto the lungs for visual clarity.](https://img.auntminnie.com/mindful/smg/workspaces/default/uploads/2026/03/genkin.25LqljVF0y.jpg?auto=format%2Ccompress&crop=focalpoint&fit=crop&h=100&q=70&w=100)


![Images show the pectoralis muscles of a healthy male individual who never smoked (age, 66 years; height, 178 cm; body mass index [BMI, calculated as weight in kilograms divided by height in meters squared], 28.4; number of cigarette pack-years, 0; forced expiratory volume in 1 second [FEV1], 97.6% predicted; FEV1: forced vital capacity [FVC] ratio, 0.71; pectoralis muscle area [PMA], 59.4 cm2; pectoralis muscle volume [PMV], 764 cm3) and a male individual with a smoking history and chronic obstructive pulmonary disorder (COPD) (age, 66 years; height, 178 cm; BMI, 27.5; number of cigarette pack-years, 43.2, FEV1, 48% predicted; FEV1:FVC, 0.56; PMA, 35 cm2; PMV, 480.8 cm3) from the Canadian Cohort Obstructive Lung Disease (i.e., CanCOLD) study. The CT image is shown in the axial plane. The PMV is automatically extracted using the developed deep learning model and overlayed onto the lungs for visual clarity.](https://img.auntminnie.com/mindful/smg/workspaces/default/uploads/2026/03/genkin.25LqljVF0y.jpg?auto=format%2Ccompress&crop=focalpoint&fit=crop&h=112&q=70&w=112)


