Tuesday, November 30 | 9:15 a.m.-9:25 a.m. | VC31-04 | Room S404CD
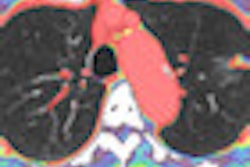
Distinguishing malignant from benign lung nodules using PET is tricky business, notably because not all lung cancers are glucose-avid. But in this Tuesday morning presentation, researchers from Kobe, Japan, will discuss how they found that perfusion CT on a 32-detector-row scanner and MRI both perform better than PET/CT for distinguishing malignant from benign nodules.Yoshiharu Ohno, MD, PhD, of Kobe University, and his group examined 43 consecutive patients with 61 nodules using three modalities: 320-detector-row perfusion CT, dynamic MRI on a 1.5-tesla scanner, and integrated FDG-PET/CT.
Nodule perfusion in CT was calculated using single-input maximum slope and the Patlak-pilot methods, along with blood volume. MRI used maximum relative enhancement ratio and maximum slope of enhancement ratio. In PET/CT, maximum standardized uptake values (SUVmax) were assessed.
All but two indices showed significant differences between malignant and benign nodules (p < 0.05) at first-pass perfusion CT. Accuracies of single-input maximum slope (88.5%) and maximum slope of enhancement ratio (86.9%) at CT were significantly higher than SUVmax in PET/CT (73.8%). CT was at least as accurate as dynamic MRI and significantly more accurate than PET/CT for detecting malignant lung nodules, the team concluded.

![Images show the pectoralis muscles of a healthy male individual who never smoked (age, 66 years; height, 178 cm; body mass index [BMI, calculated as weight in kilograms divided by height in meters squared], 28.4; number of cigarette pack-years, 0; forced expiratory volume in 1 second [FEV1], 97.6% predicted; FEV1: forced vital capacity [FVC] ratio, 0.71; pectoralis muscle area [PMA], 59.4 cm2; pectoralis muscle volume [PMV], 764 cm3) and a male individual with a smoking history and chronic obstructive pulmonary disorder (COPD) (age, 66 years; height, 178 cm; BMI, 27.5; number of cigarette pack-years, 43.2, FEV1, 48% predicted; FEV1:FVC, 0.56; PMA, 35 cm2; PMV, 480.8 cm3) from the Canadian Cohort Obstructive Lung Disease (i.e., CanCOLD) study. The CT image is shown in the axial plane. The PMV is automatically extracted using the developed deep learning model and overlayed onto the lungs for visual clarity.](https://img.auntminnie.com/mindful/smg/workspaces/default/uploads/2026/03/genkin.25LqljVF0y.jpg?auto=format%2Ccompress&crop=focalpoint&fit=crop&h=100&q=70&w=100)


![Images show the pectoralis muscles of a healthy male individual who never smoked (age, 66 years; height, 178 cm; body mass index [BMI, calculated as weight in kilograms divided by height in meters squared], 28.4; number of cigarette pack-years, 0; forced expiratory volume in 1 second [FEV1], 97.6% predicted; FEV1: forced vital capacity [FVC] ratio, 0.71; pectoralis muscle area [PMA], 59.4 cm2; pectoralis muscle volume [PMV], 764 cm3) and a male individual with a smoking history and chronic obstructive pulmonary disorder (COPD) (age, 66 years; height, 178 cm; BMI, 27.5; number of cigarette pack-years, 43.2, FEV1, 48% predicted; FEV1:FVC, 0.56; PMA, 35 cm2; PMV, 480.8 cm3) from the Canadian Cohort Obstructive Lung Disease (i.e., CanCOLD) study. The CT image is shown in the axial plane. The PMV is automatically extracted using the developed deep learning model and overlayed onto the lungs for visual clarity.](https://img.auntminnie.com/mindful/smg/workspaces/default/uploads/2026/03/genkin.25LqljVF0y.jpg?auto=format%2Ccompress&crop=focalpoint&fit=crop&h=112&q=70&w=112)


