The following is the first of a two-part series on CT colonography, based on research presented at the 2001 RSNA meeting.
In the seven years since its inception, CT colonography (a.k.a. virtual colonoscopy) has become a reliable alternative to colonoscopy and other techniques used to detect colorectal cancer. While CTC is not without its shortcomings, several large studies have recently confirmed its ability to identify polyps nearly as well as the current gold standard, colonoscopy, at least with regard to clinically significant polyps 5 mm and larger.
Colonoscopy has the advantage of being both diagnostic and therapeutic, in that polyps are detected and removed in a single procedure.
However, it is less comfortable than CTC. Comfort will be an essential selling point if large numbers of people over 50 are to be convinced to submit to colon cancer screening every 10 years, as the American Medical Association and other organizations would have it. Still, CTC is no joyride. To ensure good image data, the bowel must still be cleansed before the procedure begins, although perhaps not as rigorously as in colonoscopy, and it must be insufflated with air, a procedure that can cause cramping and discomfort.
On this front, some researchers are developing fecal tagging techniques to reduce the need for bowel cleansing, at least in patients who are elderly or in poor health.
Another key area of CTC research is software. Current challenges include the need to reduce both interpretation time and the high incidence of false-positive results that various CTC techniques have produced. In the November American Journal of Roentgenology, Dr. Joseph Ferrucci wrote that endoscopists have endorsed the increased use of CTC for colorectal cancer screening, but with caveats.
"There are firm reminders that we need to show high accuracy in low-risk screening populations, and not just in the polyp-rich cohorts that have been studied by early colonography researchers," Ferrucci wrote. "[Endoscopists] warn us that our false-positive rates must be low to avoid unnecessary follow-up studies, and that we must provide a fast and comfortable study with an affordable price structure" (AJR,Vol.177:5, pp. 975-988).
New CAD technique
A study presented at the 2001 RSNA meeting addressed many of these challenges. The researchers did not examine a typical screening population -- the patients were at high risk of colonic polyps. However, they were examined with the aid of a computer-aided diagnosis (CAD) scheme designed to minimize both false-positive results, and interpretation time.
"To be a practical screening tool for polyps, CT colonography (CTC) must be time-effective, and detect polyps with high accuracy," said presenter Hiro Yoshida, Ph.D., from the University of Chicago. "The purpose of this study was to develop a high-performance CTC scheme...and assess its performance based on colonoscopy as the gold standard."
Yoshida and colleagues Janne Nappi, Ph.D., Dr. Peter MacEneaney, Dr. David Rubin, and Dr. Abraham Dachman developed a CAD scheme that uses CT data to detect characteristic polyp shapes, followed by a texture analysis of potential polyps to reduce the number of false positives.
In the study, 72 individuals (ages 32-84, mean age 57) with suspected colonic polyps underwent colonoscopy, followed by same-day CT colonography in both supine and prone positions, using standard bowel preparation and air distension of the colon. Two patients with ulcerative colitis were excluded. Image data were acquired with either single or multislice spiral CT, using 3-5 mm collimation, pitch 1-2, 60-100 mAs, 120 kVp, and 1.5-mm to 2.5-mm reconstruction intervals.
The axial slices were interpolated along the axial direction to produce an isotropic volume data set, Yoshida said. The researchers used an anatomy-based approach to segment the colon automatically, followed by a volume-growing technique that provides a view from the inside of the colon.
Analyzing shape and texture
Next, a software-based shape-analysis technique was applied to the image data to differentiate the polyp from the colon wall, Yoshida said.
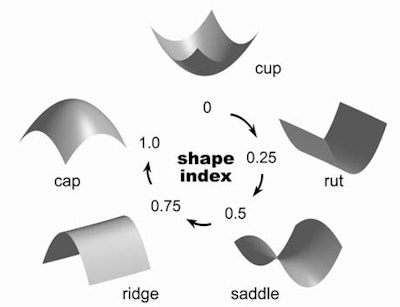
Yoshida detailed the shape and texture analysis techniques in an e-mail to AuntMinnie.com. Polyps are detected by extraction of geometric features called the shape index, which characterizes the topologic shape of a surface at a point, he wrote. Each distinct shape corresponds to a unique value of the shape index, which ranges from 0 to 1.
"For example, five well-known shapes have the following shape index values: cup (0.0), rut (0.25), saddle (0.5), ridge (0.75), and cap (1.0)," Yoshida wrote. "Polyps tend to appear as bulbous, cap-like structures adhering to the colonic wall, whereas folds appear as elongated, ridge-like structures. The colonic wall appears as a nearly flat cup-like structure. Therefore, the shape index can differentiate effectively among polyps, folds, and the colonic wall."
 |
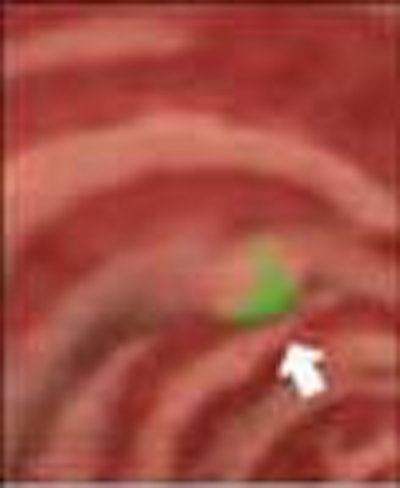
The shape-based analysis is applied to the entire colon, which shows the "polyp candidates" in green. However, at this stage there are several false positives.
"In order to remove these false positives, we apply a texture analysis inside the lesion," he told the RSNA audience. "Warped curves are generated by decision analysis as a decision boundary between the two. By eliminating one portion of the curve, we can eliminate a large number of false positives."
The texture analysis is applied to the polyp candidates using a 3-D texture scheme known as gradient concentration (GC), Yoshida wrote. A gradient vector at a voxel represents the rate of change in the CT value at a given point. In the vicinity of the point, GC characterizes the relative directions of the gradient vectors with respect to the point. If most of the gradient vectors in the vicinity of the point are directed toward it, the GC feature at the point has a high value; otherwise, the GC value is low.
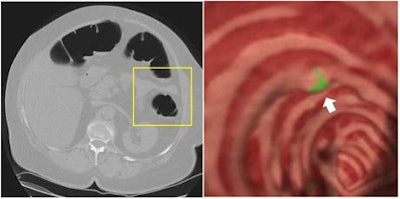 |
"The GC feature is particularly effective in differentiation of polyps from stool, one of the leading causes of false positives," Yoshida wrote. "The soft-tissue density within a small polyp tends to increase from the colonic air toward the center of the polyp. Therefore, gradient vectors tend to converge at the center of the polyp, thus showing a high GC value."
The internal texture pattern of stool tends to be more inhomogenous than that of polyps. This inhomogeneity causes the directed gradient vectors to be directed randomly rather than toward any particular point. It is these differing GC values that enable false positives due to stool to be differentiated from true polyps, Yoshida wrote.
The results of the CAD scheme were compared with colonoscopy, and verified for each patient and for each polyp. A total of 72 cases were analyzed, including 15 with adenomatous polyps, and 57 without polyps, as confirmed by colonoscopy and pathology. There were a total of 22 significant polyps > 5 mm in size. Of these, 13 polyps measured < 10 mm, and 9 were larger than 10 mm.
"For polyps greater than 10 mm by patient, sensitivity was 100%, with 1.0 false positives per patient," Yoshida said. "The results were the same for the by-polyp analysis. "For [lesions] between 5 and 9 cm, by-patient sensitivity stayed at 100%, with an increase in the false-positive rate to 2.0. By-polyp analysis showed a sensitivity of 92%, which means that one polyp was missed," and the false-positive rate was also 2.0. per data set.
Supine and prone positioning during CT image acquisition improved sensitivity of the technique, he said. During image processing, polyps that were not detected in one data set could almost always be seen in the other. Overall, application of the method identified 21 of 22 polyps compared to colonoscopy and pathology.
The entire process took about 10-15 minutes per patient, including 5-10 minutes for image processing and about minutes for interpretation. The technique was not designed to detect flat polyps, Yoshida said.
"The CAD scheme has been shown to have the potential to detect polyps in CTC with high sensitivity, and an acceptable false-positive rate," Yoshida concluded. "Therefore, it is potentially useful for reducing interpretation time, and improving the diagnosis of polyps."
A commercial product based on the group's research will debut next year in collaboration with a New York firm, he said.
By Eric BarnesAuntMinnie.com staff writer
December 21, 2001
Related Reading
CT colonography performs very well in five-year study, November 26, 2001.
E-Z-EM debuts virtual colonoscopy tagging agent, November 26, 2001
"Virtual colonoscopy" brings comfort to colon cancer surveillance, October 26, 2001
Virtual colonoscopy shows promise as method of colon cancer screening, June 27, 2001
Virtual colonoscopy not yet suitable as screening tool for colorectal neoplasia, July 7, 2000
Copyright © 2001 AuntMinnie.com

