Dark-field chest x-ray could become an option over CT for the detection and staging of emphysema in patients with chronic obstructive pulmonary disease (COPD), according to a study published January 11 in Radiology.
German researchers tested a prototype they developed to see whether dark-field x-ray signals can help visualize as well as quantify pulmonary emphysema compared to images in healthy participants. They found the dark-field chest x-ray technique correlated significantly with conventional CT measures for mild, moderate, and advanced destructive emphysema.
"Pulmonary emphysema leads to reduced signal intensity on dark-field chest radiographs, showing the technique has potential as a diagnostic tool in the assessment of lung diseases," wrote first authors Theresa Urban and Dr. Florian Gassert of the Technical University of Munich.
Dark-field chest x-ray could prove to be an improvement over CT because it is less expensive and requires less radiation dose, the researchers suggest.
Dark-field radiography exploits the physical wavelike properties of x-rays by directing beams through special gratings that can be added to existing conventional machines, according to the authors. It is particularly sensitive to microstructures, as the image contrast is formed by multiple refractions of the x-ray beam at small interfaces (small-angle scattering), such as between water and air in the alveoli in the lungs.
Emphysema is a key component of COPD, which is the third leading cause of death worldwide, causing 3.23 million deaths in 2019, according to the World Health Organization. Emphysema develops over time and involves the gradual damage of lung tissue, specifically the destruction of alveoli, or tiny air sacs. Early diagnosis of this disease is crucial.
Previously, the German group introduced a quantitative dark-field coefficient for quantifying emphysema in a recent proof-of-concept study and followed that with a reader study showing the novel technique could be used to detect and grade emphysema. In this prospective study, the group aimed to evaluate the qualitative and quantitative features of dark-field x-ray images.
The team's study involved 48 participants with emphysema and 35 control participants without emphysema (as determined by CT scans) who underwent imaging at their institution between October 2018 to October 2020. Among the 48 patients with emphysema, 21 had trace emphysema, 10 had mild emphysema, nine had moderate emphysema, and eight had confluent or advanced destructive emphysema.
Participants were all over the age of 18, and criteria for inclusion included an ability to stand upright without help. Participants were examined with a clinical dark-field chest radiography prototype that simultaneously acquired both attenuation-based radiographs and dark-field chest radiographs.
Dark-field coefficients were tested for correlation with each participant's CT-based emphysema index using the Spearman correlation test. The capability of the dark-field coefficient to enable detection of emphysema was evaluated with receiver operating characteristics curve analysis.
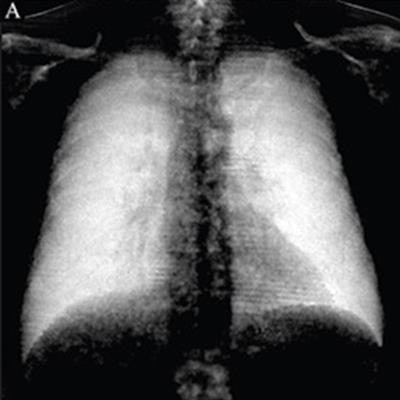
 (A, D) Dark-field radiographs, (B, E) attenuation-based radiographs, and (C, F) projections of CT-based emphysema quantification in a healthy 33-year-old man with an emphysema index of 0.1% (A-C) and a 65-year-old man with an emphysema index of 26% (D-F). The same window settings were applied within the respective modality. In B, no abnormalities are apparent. In E, flattened hemidiaphragms and an irregular area of radiolucency are visible. While the dark-field chest radiograph of the healthy subject with no emphysema in the CT-based emphysema projection exhibits a strong homogeneous dark-field signal, the dark-field signal intensity of the subject with pulmonary emphysema appears decreased overall and exhibits an inhomogeneous patchy pattern, corresponding well to the emphysema intensity in the CT-based projection (red overlay, F). Image courtesy of Radiology.
The researchers found that locations of focal signal intensity loss on dark-field images corresponded well with emphysematous areas found on CT images. The quantitative analysis showed the dark-field coefficient was negatively correlated with the CT-based emphysema index for all participants (r = -0.54; p < 0.001), the group wrote.
For the trace emphysema group, the average dark-field coefficient was similar to that of the control group (mean, 2.5 m-1 +/- 0.4 versus 2.6 m-1 +/- 0.4; p = 0.34). In the other groups, however, the average dark-field coefficient was smaller compared with control participants:
- Mild emphysema: 2.2 m-1 +/- 0.4, p = 0.02
- Moderate emphysema: 2.1 m-1 +/- 0.7, p = 0.01
- Confluent or advanced destructive emphysema: 1.3 m-1 +/- 0.6, p < 0.001
For the detection of emphysema grades mild or higher, sensitivity was 78%, specificity was 73%, and accuracy was 75%.
"Both the CT-based visual emphysema grades and the quantitative emphysema index in CT scans showed results consistent with the quantitative dark-field coefficient, suggesting that quantitative dark-field imaging may be a useful tool in the assessment of pulmonary emphysema," the authors wrote.
In an accompanying editorial, Drs. Hiroto Hatabu, PhD, of Harvard Medical School and Bruno Madore, PhD, of Laval University wrote that the study represents an important new step on the journey of a noteworthy technology, as its ability to depict and quantify a prevalent disease has been successfully tested.
However, questions regarding reproducibility, sensitivity to patient breathing and posture, capabilities in other pulmonary diseases, generalizability to 3D acquisition schemes, and the true nature of the signals will remain to be answered, in time, they stated.
"Dark-field chest radiography might, in the future, prove an advantageous alternative to CT in the detection and staging of emphysema," Hatabu and Madore concluded.