Forget about suspicious nodular opacities. A team of radiologists, pulmonologists and bioengineers are going beyond CT images to create a virtually perfect model of lung morphology and function. The five-year, $7 million research effort is being funded by the National Institute of Health's National Heart, Lung and Blood Institute.
The goal is to create a normative lung atlas that will help doctors detect lung disease far sooner and more readily than ever before.
The effort is being led by Eric Hoffman, Ph.D. and colleagues from the University of Iowa in Iowa City, with collaboration from at least five other institutions, including Johns Hopkins University in Baltimore, the Mayo Clinic in Rochester, MN, Purdue University in West Lafayette, IN, Marquette University in Milwaukee, WI, and the University of Washington in Seattle.
"Now that the Human Genome Project is coming to an end, the (National Institutes of Health) is very interested in pushing the Physiome Project, which is to now figure out how the genome integrates into the functioning organ system," Hoffman said.
Hoffman discussed the project at the 2003 International Symposium for Multidetector-row CT in San Francisco, and later by telephone and e-mail with AuntMinnie.com.
"To build a model or atlas of the normal human lung against which we can then compare the individual for early detection of disease and quantitation of disease, there are a number of steps we've had to take," Hoffman said at the symposium. "If you want to very quantitatively and sensitively follow lung pathology and early pathology, it's important to standardize the way you scan the lungs.
 |
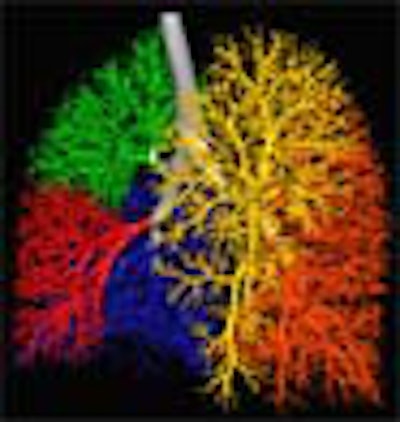
| Three-dimensional human airway tree acquired with CT at total lung capacity. First, an automated segmentation function located the centerlines, then based on the branching points of those centerlines, identified and color-coded individual airway segments. Quantitation is reported segment by segment. All images courtesy of Eric Hoffman, Ph.D. |
That means making very different lungs look very much alike. Since the model will be built on the data of hundreds of subjects with varying lung morphology, it's important to normalize the image data as much as possible during CT scanning by first finding the optimal point in the breathing cycle to begin scanning, Hoffman said.
Of course, lung volume and airway dimensions change considerably during the breathing cycle, so the group has learned to minimize volume differences between patients by scanning them at the same precise point in breathing. Tools such as the pneumotachometer, and especially the inductance plethysmograph, have been helpful in pinpointing the right time to scan, he said.
Once scanning is completed, CT data from different subjects are combined using a coregistration process that identifies a set of feature points in each subject's images, and creates correspondences between them. A landmark- and intensity-based algorithm is then applied to the data to create a normative template, against which all the datasets in the population are warped to equal the average transformation.
"The next step ... is being able to identify not only the lungs but the lobes, airways and blood vessels," he said. This process begins with finding the centerline of the airway tree, and then using the branch points as a road map. "We can then link those (branch) points from one volume to the next lung volume so you can accurately track an individual voxel within the lung across multiple lung volumes," he said. "A simple density change measurement in the parenchyma gives you an index of regional ventilation. It also gives us a way to then map an individual across time if there's a slight ... change in body configuration and so forth."
Coregistration allows the direct comparison of two different exams in the same subject. In a subject who undergoes both functional residual capacity (FRC) and total lung capacity (TLC) tests, for example, the radiologist can pick out a particular slice number and find them to be nearly identical.
 |
| Lungs of human (above) and sheep (below) are from a ventilation distribution model created in collaboration with Merryn Tawhai, Ph.D. from the University of Auckland in New Zealand. Lung, lobes and airway are located from CT data; lobes have not yet been delineated in sheep model below. The process uses the boundary conditions of the lung, lobe and airway tree to extend the branching patterns out by 7 to 9 generations in these images, though the model can be used to create a complete 23-generation airway tree. |
 |
"That's also the process by which we are developing the lung atlas," he said. "We can match individuals across each other into a single lung, and then allow that positive lung to inherit all of the anatomical and functional properties of a group of lungs and provide a range of normality."
Branching patterns in the first 7 or 8 generations of the airway tree show great commonality among individuals, he said, but the branches become highly differentiated as they get smaller --so much so that an individual's branching pattern is considered a better marker of individuality than fingerprints, he said.
Based on the location of the airway wall, the edge of the lumen, and the outer wall of the airway, the group's measurement methods use the point-spread function of the scanner and the reconstruction algorithms to provide iterative estimates of the luminal dimensions and wall thicknesses within 0.1 mm -- with histological verification, Hoffman said.
 |
| Screen shot of histogram-based analysis embedded in PASS (Pulmonary Analysis Software Suite). Built in the University of Iowa Lab, the PASS lung image display and analysis software is being commercialized by startup firm VIDA Technologies. Image courtesy of Eric Hoffman, Ph.D, who is a principal in the company. |
The resulting data measure segment length, branch angle, luminal tapering, wall thickness, luminal diameter to wall thickness, distensibilty, regional radius of curvature, cumulative luminal volume, surface-to-volume ratios, even dynamic measures such as dynamic compressions.
A look at the coregistered datasets makes it clear that each airway segment presents a unique set of characteristics in terms of its fractional area change as a function of lung volume, Hoffman said. For example, preliminary data show that the slope is shallower in the central airways and steeper in the peripheral airways.
More important, these values can be an index of progression of the severity of disease. So when expected statistical relationships go awry, the deviations can indicate early changes associated with cancer, inflammation or other conditions that may be occurring in the airway walls, he said.
Beyond the airways, Hoffman and colleagues have developed methods of measuring the lung parenchyma. In a project for the National Emphysema Trial, for example, the group came up with close to 200 measurements derived from the density histogram, in an effort to predict outcomes in lung reduction surgery.
Another technique, the adaptive multiple feature method (AMFM), draws its values from 26 different mathematical formulations of grayscale formatting of the lung, including entropy, fractal dimensions, run length, coding, and cunis of the histogram, he said. A Bayesian classifier is then used to determine the "ground truth."
"So far, a lot of our ground truth has been a consensus of 5 or 6 radiologists and pulmonologists who can agree with each other about 30% of the time about what a particular texture is, and that 30% of the time we call the ground truth," he said.
The Bayesian classifier accounts for all of the measurements for the different pathologies, and then finds groupings of, say, 3 to 5 features that separate one tissue type from another. It has succeeded in doing so to the tune of 90%-95% specificities and sensitivities for the identification of tissue types such as ground glass nodular, bronchovascular honeycombing, etc., and the group recently extended the 2-D features into 3-D.
 |
| Screen shot in Pulmonary Analysis Software Suite (PASS) shows a lung that has been color-coded for parenchymal characteristics assigned by the adaptive multiple feature method. |
Functional imaging
One project involves the use of nonradioactive nonpolarized xenon gas as a radiodense marker of regional ventilation. Traditionally limited to animal models, human studies are set to begin soon, Hoffman said, but were delayed until recently by the xenon provider's loss of investigational new device status.
A deep breathing system is used to scrub the CO2, measure and administer the xenon/oxygen mixture. Then it washes out the mixture while the researchers scan at 50 different points to regionally image the wash-in and washout of gas. The resulting map of regional air diffraction can highlight disease in the lungs, he said.
"We have found that wash-in time constants and washout time constants are not the same. And that the differences are anatomically dependent, and (also) depend on respiratory rate and other parameters of the lung. The differences in wash-in/washout rates give us a lot of new information as to the anatomic integrity of airway tree."
Perfusion imaging begins with a bolus of contrast injected at a fast .75 ml/kg into the vena cava, iohexal in animals and iodixanol (Visipaque) in humans (Amersham Health, Buckinghamshire, U.K.). The agents produce clearly delineated dye curves that can be analyzed to calculate mean transit times, arrival times, peak blood flow normalized to air tissue contents, and more.
 |
| PASS screen shot of physiological lung monitoring used to gate the CT scanning during xenon wash-in and washout. (Physiological monitoring is from a pig study, whereas the model insert lower right is of a human, similarly connected to the device.) The top wave represents mouth pressure, next down shows the percentage and title of xenon gas increasing as the lung is equilibrated to xenon. Next down is the trigger pulse (green), enabling the researchers to trigger the CT scanner in the study at both end-inspiration and end-expiration. The next wave denotes the x-ray pulse being turned on and off (blue). Next is left ventricular pressure (lime green). Next, percentage and title of CO2 (magenta), then ECG (gold, monitoring device not connected). Fewer time points are acquired in human studies in order to minimize radiation dose. |
"We had always hypothesized that the supine gradient of blood flow in the dog was not just gravity, but partially due to the branching pattern in dogs and essentially all other animals other than humans. (Animals demonstrate) a monopodial branching pattern where you have a major conducting blood vessel going to the dorso-basal region of the lung. Humans are missing that (vessel) and so we hypothesized that we should see a much more uniform distribution of perfusion supine," a hypothesis that was ultimately supported, he said.
 |
| Four-panel image shows human physiological maps superimposed onto a CT, demonstrating distribution of time to peak, mean transit time, air fraction and pulmonary blood flow, all based on a first-pass time attenuation analysis of a bolus of contrast agent. |
Finally, in a rough attempt to mimic inflammatory diseases such as emphysema, the group performed a study involving the delivery of papain to a sheep's right lung. Sixteen days later, perfusion imaging detected a disruption in a small part of the left lung, where the papain had not been delivered. The inflammatory changes seen were completely undetectable by histogram or any other grayscale or anatomic-based studies, he said. (The changes could represent some kind of auto-immune response, he said, but are more likely the result of an indirect transfer of papain from the right lung to the left.)
"We think that these functions will serve as important new harbingers of early-onset lung disease, and ways of following new interventions and new therapies," he said.
By Eric BarnesAuntMinnie.com staff writer
November 21, 2003
Copyright © 2003 AuntMinnie.com