The combination of an artificial intelligence (AI) algorithm and breast density assessment of screening mammography exams can improve detection of interval cancers, according to research published online February 8 in Radiology.
A team of researchers from the Netherlands led by Dr. Alexander Wanders of the Dutch Breast Cancer Screening Program trained a neural network to predict the risk of interval cancer by analyzing breast density assessment measurements and an AI risk score produced by a commercial breast-cancer detection model. In testing, the neural network identified 51% of women who would go on to develop interval cancer, yielding better results than relying only on the AI breast cancer detection software or breast density measurements.
"The risk model has the potential to personalize current breast cancer screening programs by defining which women benefit from additional evaluation, aiming to reduce interval cancer rates," they wrote.
Following up on recent studies in the literature that showed promising results from applying AI to screening mammograms for predicting interval cancers, the researchers sought to test their hypothesis that combining AI with breast density measurements could further improve short-term risk predictions for interval cancer.
The retrospective study included 2,222 women with interval cancer and 4,661 women in a control group from the Dutch Breast Cancer Screening Program between January 2011 and January 2015. Of these, 1,556 studies had interval cancer and 3,263 normal cases were used as training data. The remaining 2,064 studies served as the test set and included 666 false-negative exams with interval cancer and 1,398 normal exams.
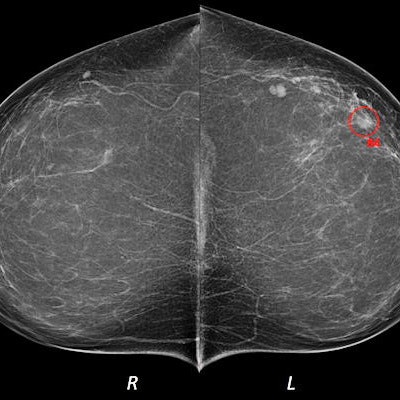
 (A) Mediolateral oblique and (B) craniocaudal digital mammograms interpreted as clinically normal in a 52-year-old woman. Artificial intelligence (AI) identified an architectural distortion (◯) on both images and assigned region scores of 92 in A and 84 in B. AI score was 10, indicating the highest risk category. Breast density was computed as 15. A 4-mm invasive lobular carcinoma was diagnosed in the left breast 9 months after screening mammography but before the next screening round. All images courtesy of the RSNA.
All mammograms were analyzed by version 1.6 of the Transpara AI software (ScreenPoint Medical). The researchers also used an open-access software application, Laboratory for Individualized Breast Radiodensity Assessment, to compute the breast density percentage on the index screening mammograms. Next, they utilized a 10-fold cross-validation method to train a neural network model that combined the AI risk score and breast density measurement analysis for predicting the risk for interval cancer.
The researchers then compared the performance of all three methods on the test set.
| Impact of AI and breast density analysis on interval cancer predictions | |||
| Breast density measurements alone | AI breast cancer detection algorithm alone | Neural network analysis of AI breast cancer risk score and breast density measurements | |
| Area under the curve (AUC) | 0.69 | 0.73 | 0.79 |
| Sensitivity at (90% specificity) | 22.4% | 37.5% | 50.9% |
The differences in AUC and sensitivity between the combined evaluation by the neural network and the individual breast density measurements and the AI breast cancer detection algorithm were both statistically significant (p < 0.001).
"In the future, we foresee the developed risk model having the potential to enable identification of women at high risk who require re-evaluation of suspicious regions on their mammogram or even to enable identification of women who benefit from additional imaging, such as [ultrasound], contrast-enhanced mammography, or MRI," the authors wrote. "We hypothesize that the performance of our risk model could further improve if temporal information from prior screening examinations is included in future models."