"How can proton therapy not be clinically better than intensity-modulated radiation therapy?" That was the question posed by Thomas Bortfeld, PhD, speaking at the recent European Society for Radiotherapy and Oncology (ESTRO) annual meeting in Barcelona, Spain.
The answer lies in uncertainty over the range of the proton beam, surmised the Harvard Medical School professor of medical physics and director of the physics research division of the Massachusetts General Hospital (MGH) Department of Radiation Oncology and its Francis H. Burr Proton Therapy Center in Boston.
This uncertainty can be reduced by measuring the proton range in vivo. Several techniques are being investigated for this purpose, including dosimetry in body cavities; other possibilities are PET and prompt gamma imaging, which detect secondary particles created as the proton beam travels through the patient. But another option is the use of MRI to visualize the proton dose distribution, by imaging radiation-induced tissue changes, Bortfeld told ESTRO attendees.
The idea is to use MRI to image tissue changes that occur on a molecular level following proton irradiation. The technique has already been successfully used to infer the delivered dose in proton therapy of the spine. Here, irradiation causes the blood-producing bone marrow to be replaced by fat, which shows up as areas of increased intensity in post-treatment MR images.
While this MR imaging method works well for treatment of bony structures, can it be used elsewhere? Bortfeld cited an example in which contrast-enhanced MRI was used to observe changes in liver tissue following brachytherapy.
After treatment, a reduction in contrast uptake was seen in the treated areas of the liver. "We expected to see a similar effect for proton therapy, and we did," he noted.
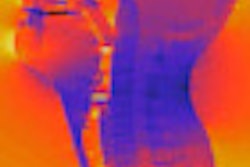
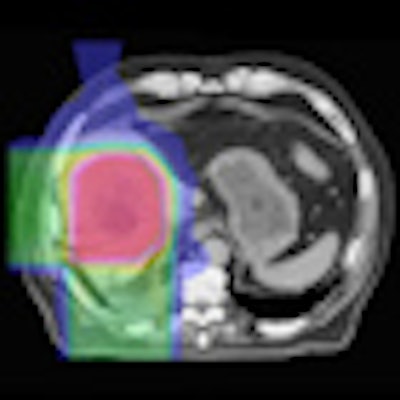
 Left: MR image taken 2.5 months after five-fraction proton therapy. Right: The corresponding planned dose distribution. Image courtesy of Thomas Bortfeld, PhD.
Bortfeld described a study performed at Massachusetts General Hospital in which MR images were recorded 2.5 months after five fractions of proton therapy. A reduced signal was seen in central parts of the liver. Contours of the area of signal reduction were in good agreement with the high-dose region in the treatment plan.
Bortfeld's research group is also trying to understand the underlying molecular process, and believes that radiation-induced and cytokine-mediated changes of the irradiated liver cells disable the active contrast media uptake.
The main advantages of MRI range imaging are better spatial resolution and improved signal-to-noise ratio compared with PET. In comparison with prompt gamma imaging, MRI can offer 3D information combined with anatomical information. The main disadvantage at present is the delay between the start of treatment and the observation of changes in the MR image.
The key question now, therefore, is whether similar changes in MR images can be observed after just a few days of treatment. If this is possible, then small misalignments could be detected between proton fractions and compensated for in later treatments. He said that Christian Richter, PhD; Joao Seco, PhD; and colleagues from MGH are currently running a trial to determine the time point in the treatment process at which such changes can be observed.
© IOP Publishing Limited. Republished with permission from medicalphysicsweb, a community website covering fundamental research and emerging technologies in medical imaging and radiation therapy.