BD²: Breakthrough Discoveries for thriving with Bipolar Disorder has released its first dataset from six research sites in the BD² Integrated Network Longitudinal Cohort Study (LCS).
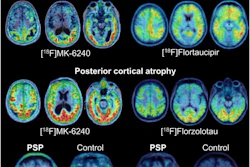
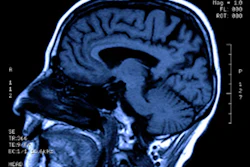
The dataset is designed to accelerate progress toward personalized care for people living with bipolar disorder, according to the organization. The release includes data from 615 deidentified participants and integrates clinical assessments, high-resolution brain imaging (MRI), wearable sensor data (Fitbit), and standardized blood bioassays.
Numerous institutions have joined BD²'s integrated network for bipolar disorder research, including Johns Hopkins University, Mass General Brigham-McLean, Mayo Clinic, Ottawa Hospital Research Institute, The Feinstein Institutes for Medical Research, University of Texas at Austin and University of Texas Health Science Center at Houston, University of California Los Angeles, University of California San Diego, University of Cincinnati/Lindner Center of HOPE, and the University of Michigan.
Sites participating in the longitudinal cohort study will play a critical role in the design and implementation of a Learning Health Network for bipolar disorder, according to BD2.
Qualified researchers may apply here.


![Overview of the study design. (A) The fully automated deep learning framework was developed to estimate body composition (BC) (defined as subcutaneous adipose tissue [SAT] in liters; visceral adipose tissue [VAT] in liters; skeletal muscle [SM] in liters; SM fat fraction [SMFF] as a percentage; and intramuscular adipose tissue [IMAT] in deciliters) from MRI. The fully automated framework comprised one model (model 1) to quantify different BC measures (SAT, VAT, SM, SMFF, and IMAT) as three-dimensional (3D) measures from whole-body MRI scans. The second model (model 2) was trained to identify standardized anatomic landmarks along the craniocaudal body axis (z coordinate field), which allowed for subdividing the whole-body measures into different subregions typically examined on clinical routine MRI scans (chest, abdomen, and pelvis). (B) BC was quantified from whole-body MRI in over 66,000 individuals from two large population-based cohort studies, the UK Biobank (UKB) (36,317 individuals) and the German National Cohort (NAKO) (30,291 individuals). Bar graphs show age distribution by sex and cohort. BMI = body mass index. (C) After the performance assessment of the fully automated framework, the change in BC measures, distributions, and profiles across age decades were investigated. Age-, sex-, and height-adjusted body composition reference curves were calculated and made publicly available in a web-based z-score calculator (https://circ-ml.github.io).](https://img.auntminnie.com/mindful/smg/workspaces/default/uploads/2026/05/body-comp.XgAjTfPj1W.jpg?auto=format%2Ccompress&fit=crop&h=112&q=70&w=112)