4D flow MRI of 3D-printed models has revealed an important clinical goal for the treatment of patients with atrial fibrillation (AF), according to research presented at the annual meeting of the American Roentgen Ray Society (ARRS) in Honolulu, HI.
After producing three types of 3D-printed models representing preoccluded, correctly occluded. and incorrectly occluded left atrial appendages, a team of researchers led by presenter Dr. Min Jae Cha from Chung-Ang University Hospital in Seoul, South Korea, found that correctly occluded left atrial appendages yielded maximal reduction in left atrial flow stasis and thrombogenicity. Their online poster earned a summa cum laude designation by the ARRS.
There is a paucity of knowledge on the actual flow dynamic changes that occur before and after percutaneous left atrial appendage occlusion (LAAO). In their study, the researchers "aimed to evaluate [left atrial] flow dynamics for pre-occluded, correctly occluded, and incorrectly occluded LAAs in patients with AF via four-dimensional (4D) flow MRI and 3D printed phantoms," said Cha in a statement from the ARRS.
First, they used cardiac CT images to generate 3D-printed left-atrial phantoms of an 86-year-old patient with persistent AF. The researchers then created a custom-made, closed-loop flow circuit with a pump that delivered pulsatile venous flow. Next, they acquired 4D flow MRI studies of the 3D-printed phantoms on an Achieva TX 3-tesla scanner (Philips Healthcare).
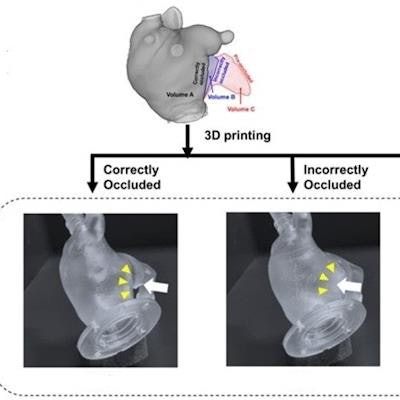
 Life-sized left atrial phantoms of an 86-year-old patient with persistent atrial fibrillation were 3D printed from cardiac CT images. Setting a custom-made, closed-loop flow circuit, a pump delivered pulsatile pulmonary venous flow. Using a 3-tesla scanner (Philips Achieva TX), 4D flow MRI was obtained, then analyzed via MATLAB-based software. Flow metrics associated with blood stasis and thrombogenicity -- stasis volume defined by velocity threshold (|V| < 3 cm/s), time-averaged wall shear stress (WSS), and endothelial cell activation potential (ECAP) --were compared among three conditions. Image and caption courtesy of the ARRS.
For all three models, the researchers compared five flow metrics -- stasis volume defined by velocity threshold (|V| < 3 cm/s), time-averaged wall shear stress, and endothelial cell activation potential -- that are associated with blood stasis and thrombogenicity. 4D flow MRI showed the different spatial distributions, orientations, and magnitudes for the left atrial appendages in all three models.
| Flow metrics for versions of 3D-printed left-atrial models | |||
| Preprocedural model | Incorrectly occluded model | Correctly occluded model | |
| Time-averaged volume | 79.11 ml | 73.17 ml | 70.82 ml |
| Percentage of left atrial flow | 39.7% | 39.02% | 38.97% |
| Lowest surface-and-time wall shear stress | 0.072 Pa | 0.059 Pa | 0.048 Pa |
What's more, the endothelial cell activation potential was also lowest in the correctly occluded model, according to the presenters.