CHICAGO - Breast MRI's popularity in supplemental cancer screening has grown significantly over the past decade, according to a study presented November 27 at the RSNA annual meeting.
Dr. Aditya Khurana from the Mayo Clinic in Rochester, MN, discussed results from his team's study that shows a compounded annual growth rate of nearly 5% between 2010 and 2019 before a drop-off owing to the COVID-19 pandemic occurred.
"As we see more studies come out about [breast MRI's] perceived clinical value, more people are using it," Khurana told AuntMinnie.com. "People are seeing the perceived clinical value to the point that it may be worth the cost because it is saving enough patient lives."
Breast MRI has become a valuable supplemental screening tool in recent years, with research showing its potential as a radiation-free method that's on par with other modalities. But have more radiology departments signed on despite MRI's higher cost?
Khurana and colleagues wanted to answer this question, gathering information from the Medicare PSPS dataset between 2010 and 2020. They did this for both contrast and noncontrast MRI volumes. To find out just how much breast MRI was used, they divided the annual number of exams by the annual number of female Part B Medicare beneficiaries.
Utilization rate was calculated by dividing the annual number of breast MRI exams by the annual number of female Part B Medicare beneficiaries. From there, they calculated the number of screening mammograms per 10,000 female Medicare enrollees for each year.
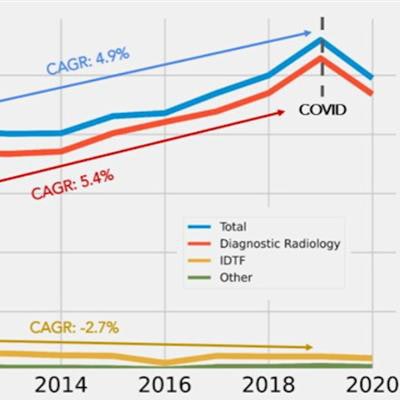
 A team led by Mayo Clinic researchers found that breast MRI's use gradually increased over the past decade, with diagnostic radiologists leading the way. However, independent diagnostic testing facilities saw an overall decrease during the same time span. The researchers also noted a drop-off in use between 2019 and 2020, owing to the COVID-19 pandemic. Image courtesy of Dr. Aditya Khurana.
The researchers found that breast MRI use increased from 36.6 to 56 exams per 10,000 enrollees between 2010 and 2019, with a compound annual growth rate (CAGR) of 4.9%. This decreased to 49.5 exams from 2019 to 2020, though the team suggested this was due to the pandemic.
They also found that diagnostic radiologists billed most exams, increasing from 32.8 per 10,000 enrollees in 2010 to 52.9 in 2019, including a CAGR of 5.4%. Independent diagnostic testing facilities meanwhile saw a decrease from three exams in 2010 to 2.4 in 2019. Both faced similar rates of decrease during the pandemic.
By location, the team also found that most exams were performed in outpatient hospital on-campus facilities, increasing from 18.3 in 2010 to 28.2 in 2019 (4.9% CAGR). Private offices also saw increases from 17.8 in 2010 to 23.4 in 2019, (3.1% CAGR).
Also, breast MRI exams performed in outpatient hospital off-campus sites began to be billed to Medicare in 2015 and grew to 4.5 per 10,000 enrolled in 2019 and continued to grow by 2.7% from 2019-2020.
Study co-author Dr. Richard Sharpe from the Mayo Clinic in Scottsdale, AZ, told AuntMinnie.com that with the paradigm of mammography having limitations, particularly in women with dense breasts or high risk, MRI can fill the gap for these patients to get an early diagnosis.
"That's the value we're really teasing out," Sharpe said.
Khurana said the team may now look at breast MRI utilization differences by specific geographic location, as well as the impact of legislation on the modality's use.