Wednesday, November 30 | 3:00 p.m.-4:00 p.m. | W7-SSBR09-3 | Room E451B
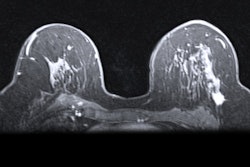
In this talk, researchers will demonstrate how initial ultrafast dynamic contrast-enhanced MRI (DCE-MRI) can aid in predicting complete pathologic response in breast cancer patients.Dr. Toulsie Ramtohul from the Paris Sciences et Lettres Research University will present the study, which looked at the links between perfusion parameters on initial ultrafast DCE-MRI and early prediction for pathological response after neoadjuvant chemotherapy in patients.
The researchers looked at six parameters in their prospective study of 50 women with an average age of 49 years. Out of these, 20 achieved pathologic complete response, while 25 had residual cancer burden.
Out of the six parameters explored, one showed promise in prediction. This parameter, known as the wash-in slope, measures the slope between the time of contrast inflow onset and the time of peak intensity in breast tumors.
The team found that a wash-in slope cutoff value of 1.6% per second had a sensitivity of 94% (17 of 18 women) and a specificity of 59% (19 of 32 women) for complete pathologic response. Wash-in slope also was also the factor most associated with predicting complete pathologic response.
Also, an area under the receiver operating characteristic curve (AUC) of 0.92 was achieved with a prediction model using the wash-in slope cutoff value, tumor-infiltrating lymphocytes, and HER2 positivity.
See what else the team found in their study at the presentation.


![Overview of the study design. (A) The fully automated deep learning framework was developed to estimate body composition (BC) (defined as subcutaneous adipose tissue [SAT] in liters; visceral adipose tissue [VAT] in liters; skeletal muscle [SM] in liters; SM fat fraction [SMFF] as a percentage; and intramuscular adipose tissue [IMAT] in deciliters) from MRI. The fully automated framework comprised one model (model 1) to quantify different BC measures (SAT, VAT, SM, SMFF, and IMAT) as three-dimensional (3D) measures from whole-body MRI scans. The second model (model 2) was trained to identify standardized anatomic landmarks along the craniocaudal body axis (z coordinate field), which allowed for subdividing the whole-body measures into different subregions typically examined on clinical routine MRI scans (chest, abdomen, and pelvis). (B) BC was quantified from whole-body MRI in over 66,000 individuals from two large population-based cohort studies, the UK Biobank (UKB) (36,317 individuals) and the German National Cohort (NAKO) (30,291 individuals). Bar graphs show age distribution by sex and cohort. BMI = body mass index. (C) After the performance assessment of the fully automated framework, the change in BC measures, distributions, and profiles across age decades were investigated. Age-, sex-, and height-adjusted body composition reference curves were calculated and made publicly available in a web-based z-score calculator (https://circ-ml.github.io).](https://img.auntminnie.com/mindful/smg/workspaces/default/uploads/2026/05/body-comp.XgAjTfPj1W.jpg?auto=format%2Ccompress&fit=crop&h=100&q=70&w=100)


![Overview of the study design. (A) The fully automated deep learning framework was developed to estimate body composition (BC) (defined as subcutaneous adipose tissue [SAT] in liters; visceral adipose tissue [VAT] in liters; skeletal muscle [SM] in liters; SM fat fraction [SMFF] as a percentage; and intramuscular adipose tissue [IMAT] in deciliters) from MRI. The fully automated framework comprised one model (model 1) to quantify different BC measures (SAT, VAT, SM, SMFF, and IMAT) as three-dimensional (3D) measures from whole-body MRI scans. The second model (model 2) was trained to identify standardized anatomic landmarks along the craniocaudal body axis (z coordinate field), which allowed for subdividing the whole-body measures into different subregions typically examined on clinical routine MRI scans (chest, abdomen, and pelvis). (B) BC was quantified from whole-body MRI in over 66,000 individuals from two large population-based cohort studies, the UK Biobank (UKB) (36,317 individuals) and the German National Cohort (NAKO) (30,291 individuals). Bar graphs show age distribution by sex and cohort. BMI = body mass index. (C) After the performance assessment of the fully automated framework, the change in BC measures, distributions, and profiles across age decades were investigated. Age-, sex-, and height-adjusted body composition reference curves were calculated and made publicly available in a web-based z-score calculator (https://circ-ml.github.io).](https://img.auntminnie.com/mindful/smg/workspaces/default/uploads/2026/05/body-comp.XgAjTfPj1W.jpg?auto=format%2Ccompress&fit=crop&h=112&q=70&w=112)


