A new cardiac MRI technique helps clinicians measure chemotherapy's effectiveness in patients with a disease called light-chain cardiac amyloidosis, or "stiff heart syndrome," a study published on July 28 in the European Heart Journal has found.
Stiff heart syndrome occurs when amyloid builds up in the heart and affects the organ's ability to pump blood. Without treatment, the condition can lead to heart failure and death, the college said in a statement.
The new MRI technique, extracellular volume mapping (ECV), could help clinicians better identify and quantify amyloid in the heart and thus offer patients better and more effective care, said senior author Prof. Dr. Marianna Fontana of University College London in the U.K. in a statement released by the journal.
"Since MRI scans are widely available, by developing the use of extracellular volume mapping in a machine that already is used for these patients, we hope that its use can be made available to more patients to help improve their care," she said. "The aim would be to use these scans routinely for all patients with the disease to help doctors monitor the response to chemotherapy ... and improve patient survival, which is very poor in patients who do not respond to treatment."
Although heart amyloid may be relatively easy to discern, it can be challenging to measure the amount of amyloidosis -- and this can make it difficult to assess the therapeutic effect of chemotherapy, the first-line treatment for stiff heart syndrome, the team noted. To address the problem, over the past decade Martinez-Navarro and colleagues have developed cardiovascular MRI extracellular volume mapping to measure both the presence and amount of amyloid protein in the heart.
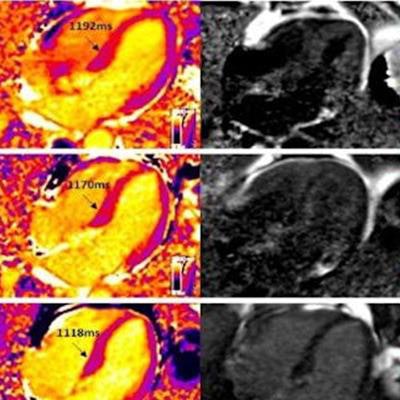
 Improvement in cardiac amyloidosis demonstrated by cardiovascular MR (CMR) extracellular volume mapping (ECV) for amyloid. Baseline scan on top row; after six months of chemotherapy mid row; and one year after chemotherapy bottom row. There are progressive reductions in CMR (identified as T1 in column two) and ECV (column four) over the course of the treatment. Image and caption courtesy of the University College London.
To test its effectiveness, the investigators conducted a study that included 176 patients with stiff heart syndrome who underwent MRI using ECV at diagnosis and at six, 12, and 24 months after starting chemotherapy. They then tracked patient response by assessing changes in the presence of amyloid protein in the heart at each of these follow-up time points.
The MRI amyloid mapping technique was able to measure the effectiveness of chemotherapy among patients with stiff heart syndrome by assessing the amount of regression of the amyloid volume.
| Effectiveness of MRI-ECV in measuring chemotherapy effectiveness in amyloidosis patients | |||
| Measure | 6 months | 12 months | 24 months |
| Amyloid volume regression | 3% | 22% | 38% |
| Amyloid volume progression | 32% | 22% | 14% |
Of the patient cohort, 25% died during the follow-up period; the authors found that an individual's chemotherapy response at six-month follow-up predicted risk of death, with a hazard ratio of 3.82 (p < 0.001) in those who had progression of the disease. But on the positive side, the study also showed that ECV data indicated that at 24-month follow-up, chemotherapy was effective in almost 40% patients with this condition.
"The scans and data made available using this technique gave us the information to both see the amount of amyloid protein and also the regression in amyloid during the course of chemotherapy treatment," said study co-author Dr. Ana Martinez-Naharro. "This is incredibly valuable for clinicians. Knowing the amount, rather than just the presence of amyloid, means they can better guide treatment by more accurately deciding timing and protocol of second-line chemotherapy treatments."