
Philips has received 510(k) clearance from the U.S. Food and Drug Administration for its MR 7700 3-tesla MRI scanner. The company is showcasing the system at this week's International Society for Magnetic Resonance in Medicine (ISMRM) conference in London.
MR 7700 is designed for both clinical and research use, with an enhanced XP gradient system featuring gradient strength of up to 65 mT/m and a peak slew rate of 220 T/m/s. First debuted at the RSNA 2021 meeting, the scanner is built on the company's existing 3-tesla magnet platform.
Philips believes the more powerful gradients deliver a payoff in terms of 35% higher signal-to-noise ratios and scan times that are up to 35% shorter. In neurology, functional MRI scans can be performed with up to 20% more volume and 50% more diffusion tensor imaging (DTI) directions. This results in more detailed high-resolution images.
In addition to clinical applications, Philips sees MR 7700 as a platform for multinuclei research and spectroscopy of metabolic and functional information across anatomies. The scanner can image six different clinically relevant nuclei across all anatomies, the company said.
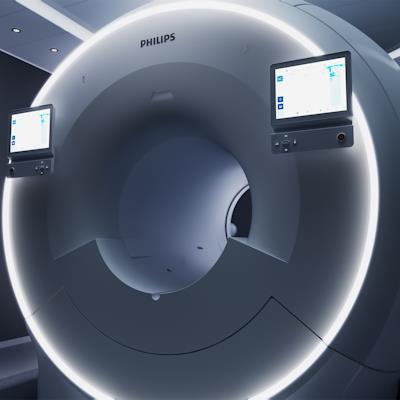
Philips' MR 7700 3-tesla MRI scanner features more powerful gradients for clinical and research use.As an example, MR 7700 users could conduct sodium 23 (Na-23) imaging to measure metabolic rates in the brain as a biomarker for neurodegenerative disease or to follow stroke and ischemia, or even to measure cartilage health. Another possibility is to analyze phosphorus 31 (P-31) spectroscopy to measure the energy metabolism in the brain for applications such as oncology or hemodynamic impairment.
Philips said MR 7700 sports a user interface similar to other scanners in its product line, and the scanner also features patient sensing and motion detection to help sites handle increased patient volume.

![Overview of the study design. (A) The fully automated deep learning framework was developed to estimate body composition (BC) (defined as subcutaneous adipose tissue [SAT] in liters; visceral adipose tissue [VAT] in liters; skeletal muscle [SM] in liters; SM fat fraction [SMFF] as a percentage; and intramuscular adipose tissue [IMAT] in deciliters) from MRI. The fully automated framework comprised one model (model 1) to quantify different BC measures (SAT, VAT, SM, SMFF, and IMAT) as three-dimensional (3D) measures from whole-body MRI scans. The second model (model 2) was trained to identify standardized anatomic landmarks along the craniocaudal body axis (z coordinate field), which allowed for subdividing the whole-body measures into different subregions typically examined on clinical routine MRI scans (chest, abdomen, and pelvis). (B) BC was quantified from whole-body MRI in over 66,000 individuals from two large population-based cohort studies, the UK Biobank (UKB) (36,317 individuals) and the German National Cohort (NAKO) (30,291 individuals). Bar graphs show age distribution by sex and cohort. BMI = body mass index. (C) After the performance assessment of the fully automated framework, the change in BC measures, distributions, and profiles across age decades were investigated. Age-, sex-, and height-adjusted body composition reference curves were calculated and made publicly available in a web-based z-score calculator (https://circ-ml.github.io).](https://img.auntminnie.com/mindful/smg/workspaces/default/uploads/2026/05/body-comp.XgAjTfPj1W.jpg?auto=format%2Ccompress&fit=crop&h=100&q=70&w=100)


![Overview of the study design. (A) The fully automated deep learning framework was developed to estimate body composition (BC) (defined as subcutaneous adipose tissue [SAT] in liters; visceral adipose tissue [VAT] in liters; skeletal muscle [SM] in liters; SM fat fraction [SMFF] as a percentage; and intramuscular adipose tissue [IMAT] in deciliters) from MRI. The fully automated framework comprised one model (model 1) to quantify different BC measures (SAT, VAT, SM, SMFF, and IMAT) as three-dimensional (3D) measures from whole-body MRI scans. The second model (model 2) was trained to identify standardized anatomic landmarks along the craniocaudal body axis (z coordinate field), which allowed for subdividing the whole-body measures into different subregions typically examined on clinical routine MRI scans (chest, abdomen, and pelvis). (B) BC was quantified from whole-body MRI in over 66,000 individuals from two large population-based cohort studies, the UK Biobank (UKB) (36,317 individuals) and the German National Cohort (NAKO) (30,291 individuals). Bar graphs show age distribution by sex and cohort. BMI = body mass index. (C) After the performance assessment of the fully automated framework, the change in BC measures, distributions, and profiles across age decades were investigated. Age-, sex-, and height-adjusted body composition reference curves were calculated and made publicly available in a web-based z-score calculator (https://circ-ml.github.io).](https://img.auntminnie.com/mindful/smg/workspaces/default/uploads/2026/05/body-comp.XgAjTfPj1W.jpg?auto=format%2Ccompress&fit=crop&h=112&q=70&w=112)


