
Magnetoencephalography (MEG) developer FieldLine has launched HEDscan, a noninvasive whole-head MEG system designed for research of mental health diseases.
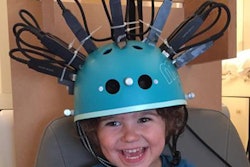
HEDscan uses MEG in a helmet design to provide noninvasive imaging of brain function. The device uses 128 synchronized quantum magnetic sensors built with FieldLine's microfabrication techniques and generates 3D videos of brain activity.
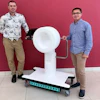
FieldLine's HEDscan MEG helmet. Image courtesy of FieldLine.FieldLine believes that HEDscan can be used for a variety of applications in neuroscience research and diagnosis, including Alzheimer's disease and post-traumatic stress disorder.
The company is positioning HEDscan as a next-generation MEG system that is easy for patients to wear and is available at a lower price point that makes the system more accessible to institutions that previously couldn't afford a MEG scanner.
FieldLine is accepting orders for HEDscan for the neuroscience research market.


![Overview of the study design. (A) The fully automated deep learning framework was developed to estimate body composition (BC) (defined as subcutaneous adipose tissue [SAT] in liters; visceral adipose tissue [VAT] in liters; skeletal muscle [SM] in liters; SM fat fraction [SMFF] as a percentage; and intramuscular adipose tissue [IMAT] in deciliters) from MRI. The fully automated framework comprised one model (model 1) to quantify different BC measures (SAT, VAT, SM, SMFF, and IMAT) as three-dimensional (3D) measures from whole-body MRI scans. The second model (model 2) was trained to identify standardized anatomic landmarks along the craniocaudal body axis (z coordinate field), which allowed for subdividing the whole-body measures into different subregions typically examined on clinical routine MRI scans (chest, abdomen, and pelvis). (B) BC was quantified from whole-body MRI in over 66,000 individuals from two large population-based cohort studies, the UK Biobank (UKB) (36,317 individuals) and the German National Cohort (NAKO) (30,291 individuals). Bar graphs show age distribution by sex and cohort. BMI = body mass index. (C) After the performance assessment of the fully automated framework, the change in BC measures, distributions, and profiles across age decades were investigated. Age-, sex-, and height-adjusted body composition reference curves were calculated and made publicly available in a web-based z-score calculator (https://circ-ml.github.io).](https://img.auntminnie.com/mindful/smg/workspaces/default/uploads/2026/05/body-comp.XgAjTfPj1W.jpg?auto=format%2Ccompress&fit=crop&h=112&q=70&w=112)
