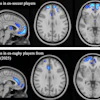
Young children who spent more time in front of screens than recommended by the American Academy of Pediatrics (AAP) had lower white-matter integrity on brain MR images and reduced language and literacy skills compared with other children in a study published online November 4 in JAMA Pediatrics.
The researchers from Cincinnati Children's Hospital Medical Center in Ohio examined 47 children between the ages of 3 and 5 who completed cognitive tests and underwent diffusion-tensor MR imaging (DTI-MRI). They found that children who spent the most time in front of a screen tended to have the worst cognitive function and lowest white-matter integrity.
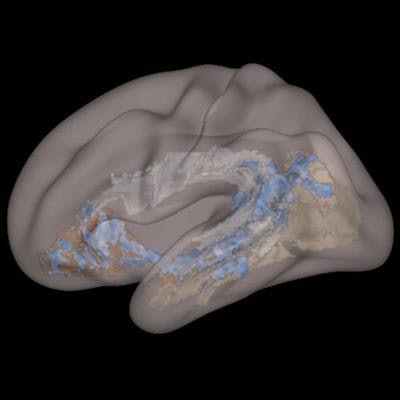
 White matter showing reduced structural integrity (blue) on the DTI-MR images of a child exposed to significant screen time. Image courtesy of Cincinnati Children's Hospital Medical Center.
To be specific, the researchers identified a negative correlation between screen time and scores on language processing, vocabulary, and literacy tests (p < 0.01). They also found that high screen time correlated with a reduction in fractional anisotropy and increased radial diffusivity (p < 0.05), markers indicating microstructural organization and myelination of white-matter tracts on DTI-MR images.
"This study raises questions as to whether at least some aspects of screen-based media use in early childhood may provide suboptimal stimulation during this rapid, formative state of brain development," lead author Dr. John Hutton said in a statement.
Though the study was not able to confirm that increased screen time was the sole cause of these structural changes, the findings do warrant further investigation, as providers, policymakers, and parents aim to set appropriate limits for screen-based media, he concluded.