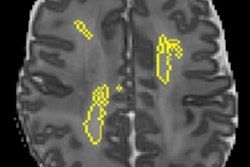
By analyzing the white-matter connections of an infant's brain at birth on MRI, an artificial intelligence (AI) algorithm can predict the level of cognitive development at age 2 -- offering the potential to facilitate early interventions in at-risk children, according to research published in the May 15 issue of NeuroImage.
After training a deep-learning algorithm to analyze white-matter connections on brain MRIs at birth in full-term infants, a team of researchers from the University of North Carolina (UNC) School of Medicine found that it produced 98% accuracy for correlating with actual individual cognitive scores at 2 years old. In testing on a separate set of preterm infants, the algorithm yielded 96% accuracy.
"Our study finds that the white-matter network at birth is highly predictive and may be a useful imaging biomarker," senior author Dr. John Gilmore said in a statement from UNC. "The fact that we could replicate the findings in a second set of children provides strong evidence that this may be a real and generalizable finding."
Although evidence suggests that the foundational wiring of the human brain is in place at birth and that the white-matter connectome supports developing brain function, it's unknown how the white-matter connectome at birth supports emergent cognition, according to the researchers. As a result, lead author Jessica Girault, PhD, of the Carolina Institute for Developmental Disabilities and colleagues sought to use a deep-learning method to determine the predictive ability of white-matter connectomes at birth. They also wanted to identify the white-matter connectome features that were important for classification accuracy (NeuroImage, May 15, 2019, Vol. 192, pp. 145-155).
Using diffusion-weighted MR images acquired shortly after birth, the researchers trained a deep-learning algorithm to classify 75 full-term infants as scoring above or below the median level of Early Learning Composite (ELC) cognitive scores at age 2. These results were then used to predict individual cognitive scores. Next, they tested the model on a sample of 37 premature infants who received MRI scans at approximately the equivalent term age of the full-term infants.
| Accuracy of deep-learning algorithm in predicting cognitive development | ||
| Full-term infants | Preterm infants | |
| Predicting two-year cognitive score group (above or below median level) | 89.5% | 83.8% |
| Correlation with actual individual cognitive scores | 98% | 96% |
"This prediction could help identify children at risk for poor cognitive development shortly after birth with high accuracy," Gilmore said. "For these children, an early intervention in the first year or so of life -- when cognitive development is happening -- could help improve outcomes. For example, in premature infants who are at risk, one could use imaging to see who could have problems."
The researchers noted that white-matter connections within the frontal lobe and between the frontal lobe and other brain areas were important for classification.
They wrote that future work "should focus on identifying the ways in which prenatal mechanisms of [white-matter] development are influenced by genetic factors as well as the intra- and extrauterine environment to shape individual differences in the [white-matter] connectome that serves as a biological foundation for learning."