Using functional connectivity MRI (fcMRI) scans to show how various brain networks interact and activate to perform basic daily tasks may someday help diagnose abnormalities in people with brain disorders, according to a study published April 18 in Neuron.
While the findings are preliminary, researchers from Washington University in St. Louis are hopeful that the approach could provide insight into variations in cognitive ability and personality traits, as well as brain dysfunction.
For the study, nine researchers took turns undergoing a variety of MRI scans late at night, dubbing their group the Midnight Scan Club, according to a release from the university. During the scans, each person performed tasks related to vision, memory, reading, or motor skills, or the person rested quietly. The group then analyzed data from more than 10 hours of fcMRI scans and 10 separate one-hour sessions performed on each person (Neuron, April 18, 2018, Vol. 98:2, pp. 439-452.e5).
From the data, first author Caterina Gratton, PhD, created a dynamic functional connectivity map of the brain's outer surface and activity changes in 333 regions over time. The goal was to identify areas that became active and inactive in unison. Network maps were also created for each individual, showing patterns of correlation between parts of the brain.
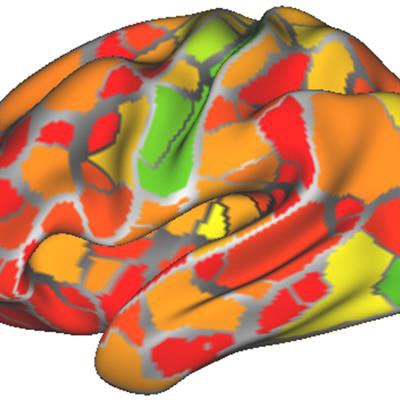
 The researchers created the heat map using data from the brain networks of nine people. The map shows the areas of most (red) to least (green) change from person to person. Image courtesy of Caterina Gratton, PhD.
The vast amount of data for each person allowed Gratton to determine how much an individual's brain networks changed from day to day based on different mental tasks. The conclusion: There is very little change at all.
"Whether someone's watching a movie or thinking about their breakfast or moving their hands makes only a small difference," she said in the release.
That consistency actually makes fcMRI a promising diagnostic tool to identify brain disorders and diseases. While the technique's potential was noted years ago, fcMRI-based diagnostic tests have not become part of the clinical routine because clinicians cannot tell which scans reflect fundamental, stable features of the brain or if the brain changes with every passing thought.
More data are needed before researchers can accurately determine the difference between normal variation in brain activity and a disorder or abnormal activity.
"The individual differences were really easy to pick up, even in a population that is really very similar," Gratton said. "It is exciting to think that these individual differences may be related to personality, cognitive ability, or psychiatric or neurological disease. Thanks to this work, we know we have a reliable tool to study these possibilities."