
Major depressive disorder and social anxiety disorder lead to abnormal modifications of the brain's cortex that can be seen on MRI, according to a new study being presented by researchers from China at the RSNA 2017 annual meeting in Chicago.
Depression affects an estimated 16 million people in the U.S., and approximately 15 million adults deal with social anxiety disorder. Depression and anxiety disorders are serious conditions that can interfere with daily activities, hinder relationships, and even trigger suicidal thoughts.
The similarity in clinical symptoms between the two disorders suggests their potential to share similar mechanisms in the brain, said lead author Dr. Youjin Zhao, PhD, from Sichuan University in Chengdu in a release from the RSNA.
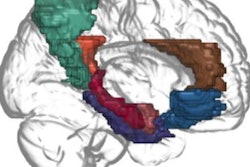
As a means of exploring this connection, the researchers used MRI to observe changes to gray matter in the brain in 37 patients with clinical depression and 24 patients with anxiety. The resulting MR images revealed irregularities in regions of the brain responsible for focus and attention (the salience and dorsal attention networks).
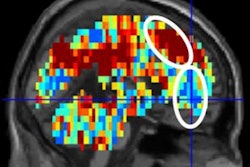
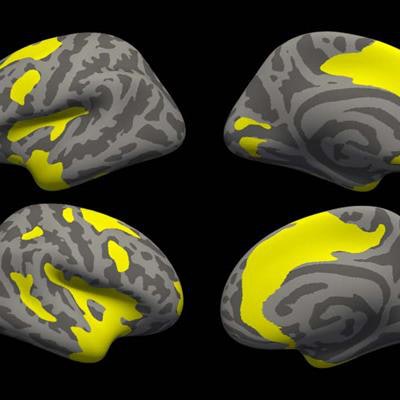
MR image indicating cortical thickness. Image courtesy of the RSNA.They also found that depression prompted structural adjustments in the patients' visual recognition network, which is crucial for social functioning. Anxiety, on the other hand, was associated with changes to areas in the brain tied to fear.
What's more, patients with depression or anxiety showed disproportionate thickening or thinning of the cerebral cortex, compared with the 41 patients without the disorders. The MR images showed cortical thickening in the anterior cingulate cortex -- a part of the brain linked to emotion -- and thinning in the insular cortex, which plays a role in perception and self-awareness.
"Our findings provide preliminary evidence of common and specific gray-matter changes in [depression and anxiety] patients," Zhao said. "Future studies with larger sample sizes combined with machine-learning analysis may further aid the diagnostic and prognostic value of structural MRI."


![Overview of the study design. (A) The fully automated deep learning framework was developed to estimate body composition (BC) (defined as subcutaneous adipose tissue [SAT] in liters; visceral adipose tissue [VAT] in liters; skeletal muscle [SM] in liters; SM fat fraction [SMFF] as a percentage; and intramuscular adipose tissue [IMAT] in deciliters) from MRI. The fully automated framework comprised one model (model 1) to quantify different BC measures (SAT, VAT, SM, SMFF, and IMAT) as three-dimensional (3D) measures from whole-body MRI scans. The second model (model 2) was trained to identify standardized anatomic landmarks along the craniocaudal body axis (z coordinate field), which allowed for subdividing the whole-body measures into different subregions typically examined on clinical routine MRI scans (chest, abdomen, and pelvis). (B) BC was quantified from whole-body MRI in over 66,000 individuals from two large population-based cohort studies, the UK Biobank (UKB) (36,317 individuals) and the German National Cohort (NAKO) (30,291 individuals). Bar graphs show age distribution by sex and cohort. BMI = body mass index. (C) After the performance assessment of the fully automated framework, the change in BC measures, distributions, and profiles across age decades were investigated. Age-, sex-, and height-adjusted body composition reference curves were calculated and made publicly available in a web-based z-score calculator (https://circ-ml.github.io).](https://img.auntminnie.com/mindful/smg/workspaces/default/uploads/2026/05/body-comp.XgAjTfPj1W.jpg?auto=format%2Ccompress&fit=crop&h=100&q=70&w=100)


![Overview of the study design. (A) The fully automated deep learning framework was developed to estimate body composition (BC) (defined as subcutaneous adipose tissue [SAT] in liters; visceral adipose tissue [VAT] in liters; skeletal muscle [SM] in liters; SM fat fraction [SMFF] as a percentage; and intramuscular adipose tissue [IMAT] in deciliters) from MRI. The fully automated framework comprised one model (model 1) to quantify different BC measures (SAT, VAT, SM, SMFF, and IMAT) as three-dimensional (3D) measures from whole-body MRI scans. The second model (model 2) was trained to identify standardized anatomic landmarks along the craniocaudal body axis (z coordinate field), which allowed for subdividing the whole-body measures into different subregions typically examined on clinical routine MRI scans (chest, abdomen, and pelvis). (B) BC was quantified from whole-body MRI in over 66,000 individuals from two large population-based cohort studies, the UK Biobank (UKB) (36,317 individuals) and the German National Cohort (NAKO) (30,291 individuals). Bar graphs show age distribution by sex and cohort. BMI = body mass index. (C) After the performance assessment of the fully automated framework, the change in BC measures, distributions, and profiles across age decades were investigated. Age-, sex-, and height-adjusted body composition reference curves were calculated and made publicly available in a web-based z-score calculator (https://circ-ml.github.io).](https://img.auntminnie.com/mindful/smg/workspaces/default/uploads/2026/05/body-comp.XgAjTfPj1W.jpg?auto=format%2Ccompress&fit=crop&h=112&q=70&w=112)


