Dear AuntMinnie Member,
Do we need a better way to describe what happens to patients when they exhibit symptoms of exposure to gadolinium-based MRI contrast agents?
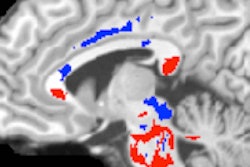
MRI expert Dr. Richard Semelka thinks so. He believes that some patients experience effects of gadolinium exposure that could be clinically significant but that fall short of nephrogenic systemic fibrosis, a debilitating and sometimes fatal disease that's been linked to gadolinium administration.
Dr. Semelka and colleagues are proposing two new terms to describe the effects of gadolinium on some patients -- terms that include the problem of retained gadolinium that's been described in recent clinical studies. Learn more by clicking here, or visit our MRI Community at mri.auntminnie.com.
Ultralow-dose CT for COPD
You've heard of low-dose CT, but how about ultralow-dose CT? Researchers from Japan used an iterative reconstruction protocol to get radiation dose down to 4% of standard-dose CT for scanning patients with chronic obstructive pulmonary disease (COPD).
Sure, the dose was low, but how well did the technique actually work? The researchers compared it with standard-dose CT using software that enables the quantitative evaluation of lung function -- a key metric in assessing therapy response in COPD patients. Find out how it stacked up by clicking here, or visit our CT Community at ct.auntminnie.com.
5 steps to a better IT strategy
Are you doing everything you can to get the most out of your imaging IT system? In a new column for our Imaging Informatics Community, Jef Williams of Paragon Consulting Partners assesses the evolving landscape of healthcare IT and offers five things you can do to ensure you're asking the right questions of your IT vendor. Read all about it by clicking here, or visit our Imaging Informatics Community at informatics.auntminnie.com.


![Overview of the study design. (A) The fully automated deep learning framework was developed to estimate body composition (BC) (defined as subcutaneous adipose tissue [SAT] in liters; visceral adipose tissue [VAT] in liters; skeletal muscle [SM] in liters; SM fat fraction [SMFF] as a percentage; and intramuscular adipose tissue [IMAT] in deciliters) from MRI. The fully automated framework comprised one model (model 1) to quantify different BC measures (SAT, VAT, SM, SMFF, and IMAT) as three-dimensional (3D) measures from whole-body MRI scans. The second model (model 2) was trained to identify standardized anatomic landmarks along the craniocaudal body axis (z coordinate field), which allowed for subdividing the whole-body measures into different subregions typically examined on clinical routine MRI scans (chest, abdomen, and pelvis). (B) BC was quantified from whole-body MRI in over 66,000 individuals from two large population-based cohort studies, the UK Biobank (UKB) (36,317 individuals) and the German National Cohort (NAKO) (30,291 individuals). Bar graphs show age distribution by sex and cohort. BMI = body mass index. (C) After the performance assessment of the fully automated framework, the change in BC measures, distributions, and profiles across age decades were investigated. Age-, sex-, and height-adjusted body composition reference curves were calculated and made publicly available in a web-based z-score calculator (https://circ-ml.github.io).](https://img.auntminnie.com/mindful/smg/workspaces/default/uploads/2026/05/body-comp.XgAjTfPj1W.jpg?auto=format%2Ccompress&fit=crop&h=100&q=70&w=100)


![Overview of the study design. (A) The fully automated deep learning framework was developed to estimate body composition (BC) (defined as subcutaneous adipose tissue [SAT] in liters; visceral adipose tissue [VAT] in liters; skeletal muscle [SM] in liters; SM fat fraction [SMFF] as a percentage; and intramuscular adipose tissue [IMAT] in deciliters) from MRI. The fully automated framework comprised one model (model 1) to quantify different BC measures (SAT, VAT, SM, SMFF, and IMAT) as three-dimensional (3D) measures from whole-body MRI scans. The second model (model 2) was trained to identify standardized anatomic landmarks along the craniocaudal body axis (z coordinate field), which allowed for subdividing the whole-body measures into different subregions typically examined on clinical routine MRI scans (chest, abdomen, and pelvis). (B) BC was quantified from whole-body MRI in over 66,000 individuals from two large population-based cohort studies, the UK Biobank (UKB) (36,317 individuals) and the German National Cohort (NAKO) (30,291 individuals). Bar graphs show age distribution by sex and cohort. BMI = body mass index. (C) After the performance assessment of the fully automated framework, the change in BC measures, distributions, and profiles across age decades were investigated. Age-, sex-, and height-adjusted body composition reference curves were calculated and made publicly available in a web-based z-score calculator (https://circ-ml.github.io).](https://img.auntminnie.com/mindful/smg/workspaces/default/uploads/2026/05/body-comp.XgAjTfPj1W.jpg?auto=format%2Ccompress&fit=crop&h=112&q=70&w=112)


