You like tomato and I like to-mah-to;
Potato, po-tah-to, tomato, to-mah-to-
Let’s call the whole thing off!
--George and Ira Gershwin, 1937
Despite their linguistic differences, if you asked the sparring partners in the Gershwin classic to identify the color of the tomato in question, they would no doubt concur on the answer -- red.
Or would they? Is one person’s red the same as another? How exactly does the human visual system interpret color, and what drives that interpretation? Researchers at a lab dedicated to vision and imaging technology at Stanford University are hoping to answer that question with the help of functional MRI. The group, led by Dr. Brian Wandell, a professor of psychology, neuroscience, and electrical engineering, is analyzing the representation of color in the human visual system.
Alex Wade, a postdoctoral researcher in Stanford’s department of psychology, has been working with Waddell since 1999. He received his doctorate from the Institute of Ophthalmology at University College London, U.K., where he worked on high-resolution retinal imaging. Along with another postdoctoral fellow in experimental psychology, Robert Dougherty, Wade runs Vischeck, a Web-based color-blindness simulator. Wade corresponded with AuntMinnie.com regarding the basics of the work currently underway at his lab.
What does it mean to image the representation of color in the human visual system?
We focus on the low-level aspects of color perception. We ask ‘What happens in the brain when signals first enter the visual cortex?’ There’s a stream of nerve impulses coming from the eye, carrying information about all sorts of things – shape, motion, color, depth, etc.
Somewhere in the brain, this information is split apart and analyzed so that you can answer questions about what color something is, how far away it is, how fast it’s moving, and so on.
It seems to us that there is no one ‘color area’ in the brain, that color vision is the result of a series of computations that start in the retina and end somewhere anterior to the visual cortex.
One approach to this is to treat the visual cortex as a machine for image processing, and to try to probe it. The fMRI scanner allows us to place our ‘test probes’ wherever we like in the visual cortex and then take recordings of the brain’s response to the visual stimuli that we are interested in.
We might ask a question like ‘What happens to neuronal activity if you double the saturation of a color signal?’ and then look in different visual areas to find the answer.
You might find some parts of the brain that double their activity, some that respond to certain colors, and some that just don’t care. You start to get a handle on where color is processed in the brain, and what sorts of computations the brain is doing to extract color information.
Why use functional MRI?
Functional MRI picks up tiny differences in blood oxygenation levels in the tissue of the brain. fMRI is non-invasive and (apparently) totally safe. I’ve probably had close to 75 one-hour scans in the past year and a half and there are plenty of fMRI veterans around with several hundred scans logged and no ill effects.

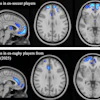
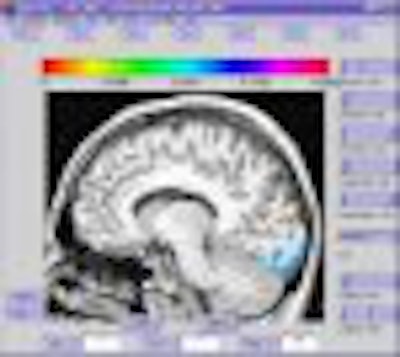
A cross section of the brain viewed using in-house data analysis tools. The colored areas represent regions that were activated by a visual stimulus presented to the subject during an fMRI scan.
What about using PET, because you are looking for functional information rather than anatomical?
PET…is not the sort of thing that subjects are very happy to volunteer for (and I know – I’ve done it!) You can’t do repeat studies for safety reasons. If you find something interesting in a PET scan, you can’t investigate further. With fMRI you can bring them back and scan them many times.
Also, the spatial resolution of a PET scan is on the order of a centimeter. By contrast, fMRI gives you a spatial resolution of a few millimeters.
What’s the imaging protocol?
The scanner is a 3-tesla GE Signa scanner sited at the [Richard M. Lucas Center for Magnetic Resonance Spectroscopy and Imaging] at Stanford. We use T2-weighted imaging. Our temporal resolution is on the order of 1.2 to 3 seconds, and our voxel sizes are about 2 x 2 x 3 mm3. In a normal scan, we collect data from just the back of the head, where the visual cortex is situated. Occasionally, we cover more brain, auditory, and somatosensory cortex, in particular. [These areas sometimes respond to visual and auditory stimulation].
The only slightly unusual thing that they do at the Lucas Center is to acquire images using what’s known as a ‘spiral’ trajectory. This is apparently more resistant to motion artifacts and noise.
How can information about the color vision of "normals" aid in diagnosing and treating color deficiencies, such as color blindness or a loss of vision because of trauma or injury?
We use the visual system as a model of the rest of the brain. [The visual system] is relatively well characterized, and we can put clear inputs through the eyes and see what happens in the brain. So we think that the sorts of things we find out about the visual system, regarding computational methods and pathways, will help us understand the brain in general.
Do you see the work having clinical applications down the road?
I’d answer with a heavily qualified ‘yes.’ And the qualification is that I don’t foresee real clinical treatments for damage to the visual cortex for at least 20 or 30 years. Ordinary color blindness is really a non-starter because (a) it’s a retinal problem, present from birth and (b) it’s pretty harmless. There’s just not a lot of incentive to pour money or effort into research to ‘cure’ it.
Eventually, a few decades from now, I think you are likely to have rudimentary prosthetic devices that can excite early, visual cortex to provide some sort of vision to people with severe retinal damage. If you want to include color information in this picture, you will eventually need to know the sorts of things we are discovering here.
We want to answer questions like ‘How is color constancy computed in the brain?’ or ‘What neuronal circuits contribute to color awareness?’ rather than where this or that particular sensation is located.
A nice analogy might be a computer: You can take a photograph of the circuit board and point out where all the components are, but it’s also useful to have an abstract circuit diagram that tells you how different chips respond to different inputs. We’d like to start drawing that diagram for color vision one day.
By Shalmali PalAuntMinnie.com staff writer
September 5, 2000
Related Reading
"Comparison of Visual Activation Measured by fMRI and High Resolution EEG," NeuroImage, 1998.
Let AuntMinnie.com know what you think about this story.
Copyright © 2000 AuntMinnie.com