An AI-powered automated plaque quantification tool for coronary CT angiography (CCTA) performs on par with intravascular ultrasound (IVUS) for quantifying heart plaque volume and characterizing plaque, researchers have reported.
The results contribute to the literature regarding the efficacy of AI across a variety of indications, according to a team led by Abdul Rahman Ihdayhid, MD, of Fiona Stanley Hospital in Perth, Australia. The research was published November 14 in Radiology: Cardiothoracic Imaging.
"Our findings suggest that automated AI and DL [deep learning] offer alternatives to semiautomated software solutions for plaque quantification CCTA," the group wrote.
CCTA is the go-to test for patients with symptoms of coronary artery disease to determine presence, extent, and composition of atherosclerosis, the team explained. But there's "growing interest" in using AI to quantify and characterize coronary plaque, it noted – and the use of AI in this manner must be validated by comparing its results to "accepted standards" such as IVUS.
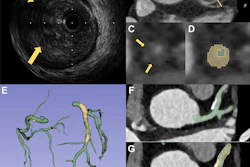
Ihdayhid's group sought to assess the diagnostic performance of a CCTA AI tool (AI-QCPA, HeartFlow) as compared with IVUS to quantify plaque volume in the heart via an analysis of research that included 33 individuals with myocardial infarction that was treated with percutaneous coronary intervention of the "culprit vessel" (the study included 67 vessels). Those participants with greater than 50% stenosis in "nonculprit vessels" underwent CCTA, invasive coronary angiography, and IVUS of these between two and 40 days after initial intervention. The team compared plaque volume findings from the AI algorithm to those from IVUS using Spearman rank correlation (ρ) and Bland-Altman analysis.
The investigators found the following:
- Strong agreement between the AI algorithm and IVUS in vessel and lumen volumes (p = 0.94 and 0.97, respectively).
- High agreement between the AI algorithm and IVUS for total plaque volume (p = 0.92), noncalcified plaque (p = 0.91), and calcified plaque (p = 0.87).
- However, Bland-Altman analysis showed that the AI algorithm underestimated total plaque volume and calcified plaque and overestimated for noncalcified plaque compared with IVUS.
The study results could lead to better identification and management of cardiovascular disease, according to the authors.
"The promising results of our DL technique provide a foundation to explore the scientific and clinical value of integrating plaque burden and morphology with the multitude of other emerging and established biomarkers derived from CCTA," they wrote.
The team did concede that one of the study's limitations was its small size, noting that "larger multicenter studies are needed to further assess the diagnostic performance of AI-enabled plaque quantification" and urging more research to "assess the role of AI-QCPA to predict cardiovascular events and guide therapeutic decision-making."
The complete study can be found here.