Abnormal pulmonary vessel and perfusion patterns often appear on CT pulmonary angiography (CTA) in patients with COVID-19 pneumonia, suggesting the important role pulmonary vascular pathology and hypoxemia play in the disease, according to a study published June 18 in Radiology: Cardiothoracic Imaging.
And adding dual-energy CT to CTA can help identify even more abnormal characteristics in the lungs of patients with COVID-19, wrote a group of researchers from Massachusetts General Hospital in Boston.
"Dual-energy CT pulmonary angiography provides insight on the vascular manifestations of COVID-19 pneumonia," a team led by Dr. Min Lang wrote.
Lang's group conducted a retrospective study that included 48 patients with reverse transcription polymerase chain reaction (RT-PCR)-confirmed COVID-19 pneumonia who had CTA between March 22 and April 5. Of these 48 patients, 25 also had dual-energy CT as part of the CTA protocol. Two chest radiologists read all the studies; any interpretation disagreements were resolved via consult with a third reader.
Of 48 patients, 45 were admitted to the hospital, 18 were admitted to the intensive care unit, and 13 required intubation. The group noted the following CTA findings:
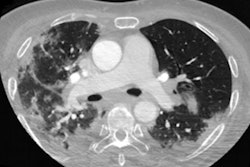
- 15% of patients had pulmonary emboli.
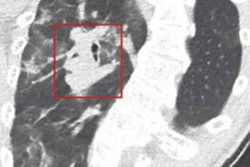
- 85% had dilated vessels; of these, 78% showed vessel enlargement inside lung opacities and 55% showed vessel enlargement outside of lung opacities.
- 82% of patients had dilated distal vessels extending to the pleura and 61% had dilated distal vessels extending to the fissures.
Adding dual-energy CT to CTA helped identify further abnormalities caused by COVID-19, according to the group: 96% of patients who had dual-energy CT exams showed a mosaic perfusion pattern; 52% showed regional hyperemia corresponding with areas of pulmonary opacities, 96% showed opacities associated with oligemia, and 36% of cases showed hyperemic halo.
The takeaway? COVID-19's effects are not confined to the lungs -- they also include a "diffuse vascular process," according to the authors.