Spectral CT is better at identifying early-stage COVID-19 disease than conventional CT, enabling better visualization of pulmonary lesions, according to a study published October 21 in the American Journal of Roentgenology.
The findings suggest a way to further improve CT's performance when it comes to diagnosing COVID-19 pneumonia, wrote a team led by Dr. Beatrice Daoud of Antony's Private Hospital in Antony, France.
"[Spectral CT] may improve the detection of early-stage COVID-19, a stage for which conventional CT has shown limited sensitivity for detection," the group noted.
The gold standard for diagnosing COVID-19 is reverse transcription polymerase chain reaction (RT-PCR) testing. But radiologic findings such as those seen on chest CT "are important for the diagnosis when RT-PCR test results are not available," and chest CT is "also crucial for evaluating the extent of the lung lesions, thereby identifying those patients who require close monitoring," Daoud and colleagues wrote.
Since spectral CT, also known as dual-energy CT, boosts contrast enhancement, reduces artifacts, and improves tissue characterization, the researchers investigated whether it could improve early assessment of COVID-19 in patients. They conducted a small study that included four patients with suspected or RT-PCR-confirmed COVID-19 who had initial and follow-up CT exams; spectral CT images were reconstructed after the initial exam.
Two interpreting radiologists found that the four patients' pulmonary lesions (45 ground-glass opacities) were more visible on the spectral CT images than on the initial conventional CT ones, and they were confirmed on the follow-up conventional CT exam. The extent of lung lesions was also easier to determine on the spectral images compared to the conventional ones, and three small lesions (less than a centimeter) were identified on spectral CT but not well visualized on initial conventional CT.
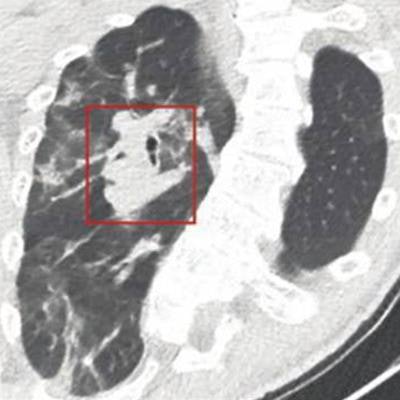
 A 41-year-old autistic woman with major scoliosis and COVID-19. (A) Initial conventional axial CT image shows no noticeable lung damage (within red box) in right upper lobe. (B) Electron-density spectral CT image obtained at the same time as the image in A shows lesions (within red box) in the right upper lobe. (C) Follow-up conventional axial chest CT image obtained five days after images in A and B confirm the presence of lesions (within the red box) in the right upper lobe. Images and caption courtesy of the ARRS.
| Extent of lung lesions using conventional and spectral CT imaging | |||
| Score on ground-glass opacity extent scale (1= surface area involvement of 10% or less; 5 = more than 75%) | |||
| Patient, left lower lobe | Initial conventional CT | Spectral CT | Follow-up conventional CT |
| Patient 1 | 2 | 3 | 3 |
| Patient 2 | 3 | 5 | 5 |
| Patient 3 | 2 | 3 | 3 |
| Patient 4 | 1 | 3 | 3 |
"These results indicate that [spectral CT] imaging improves the early assessment of the extent of ground-glass opacities that may be missed by conventional CT," the team noted. "[Spectral CT] images showed the most promising results by enhancing ground-glass contrast compared with the normal lung."
The findings are promising, but more research is needed, according to the authors.
"A thorough study of [spectral CT] imaging for improving the assessment of ground-glass opacities is warranted," they concluded.